
APPLICATIONS · TOXICOLOGY & DRUG SCREENING
Image analysis for toxicology and drug screening
From single experiments to high-content screening
Toxicology and drug discovery generate thousands of images across compounds, doses, time points and plates. QuantaCell turns them into robust, quantitative readouts: cell viability, morphological profiles, organoid growth and dose-response, from 2D cell cultures to organoids, 3D models and tissue sections.
Run the analysis yourself with our software, or entrust it to our image analysis experts: we support pharma, biotech, CROs and academic screening platforms, from assay development to full screening campaigns.
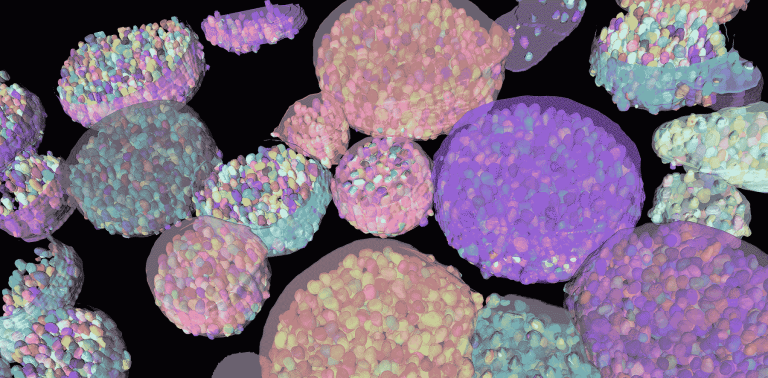

Any cell model, any assay format
All cellular models. 2D cell lines and primary cells, spheroids, organoids including patient-derived organoids, co-cultures, 3D tissue models, and tissue sections from preclinical toxicology studies.
All assay formats. Single images, z-stacks, time-lapse sequences and multi-well plates (96, 384 and more), in fluorescence and brightfield.
Your screening instruments. AssayScope automatically imports and organizes data from high-content imaging systems such as Opera Phenix, Operetta CLS, ImageXpress, CellVoyager, Evident and ZEISS systems, by plate, well, field and condition, and supports custom plate layouts for non-standard experiments.
AI-based 3D segmentation of organoids
What we measure
Viability and cytotoxicity. Live and dead cells, cell counts, nuclear condensation and fragmentation.
Proliferation and growth. Cell numbers over time, proliferation markers, organoid and spheroid size, volume and growth curves.
Morphological profiling. Hundreds of morphological, intensity and texture features per cell or organoid, to detect subtle phenotypic effects of compounds.
Subcellular phenotypes. Nuclei, mitochondria, Golgi apparatus and other organelles, spots and foci within cells.
Spatial organization. Positions and distances of cells within organoids, for example distance to the organoid border, and cell distribution in 3D.
Dynamics. Time-lapse tracking of cells and organoids to follow growth, movement and morphological changes.
Interactive gating on the distance to the organoid border, with 2D and 3D visualization
Toxicology and screening readouts we deliver
Cytotoxicity and cell death. Live/dead assays, nuclear condensation and fragmentation, membrane permeability, apoptosis and necrosis markers (cleaved caspase-3, annexin V, propidium iodide).
Proliferation and cell cycle. Cell counts over time, EdU and Ki67, DNA content and cell cycle phases, mitotic index.
Cellular stress and organelles. Mitochondrial morphology and membrane potential, oxidative stress probes, DNA damage foci (γH2AX), micronucleus assay, lipid droplets and steatosis, Golgi and lysosome phenotypes.
Organ-specific toxicity. Hepatotoxicity in hepatocytes and liver organoids, nephrotoxicity, neurotoxicity and neurite outgrowth, lung and skin models.
Morphological profiling. Cell Painting-type multiparametric profiles, phenotypic clustering and similarity between compounds.
3D models and organoids. Size, volume and growth curves, shape and compactness, necrotic cores, lumens and budding, viability in 3D, cell phenotypes and spatial organization within organoids.
Screening analytics. Dose-response curves, IC50 and EC50, plate heatmaps, well-to-well variability, normalization to controls, quality metrics such as Z′-factor, hit selection and validation back to the images.
Histopathology in preclinical toxicology. Quantification on tissue sections of liver, kidney (for example glomeruli), lung and skin: necrosis, inflammation, fibrosis and collagen, steatosis, organ-specific structures.
Functional genomics screens. RNAi and CRISPR phenotypic screens with image-based readouts.
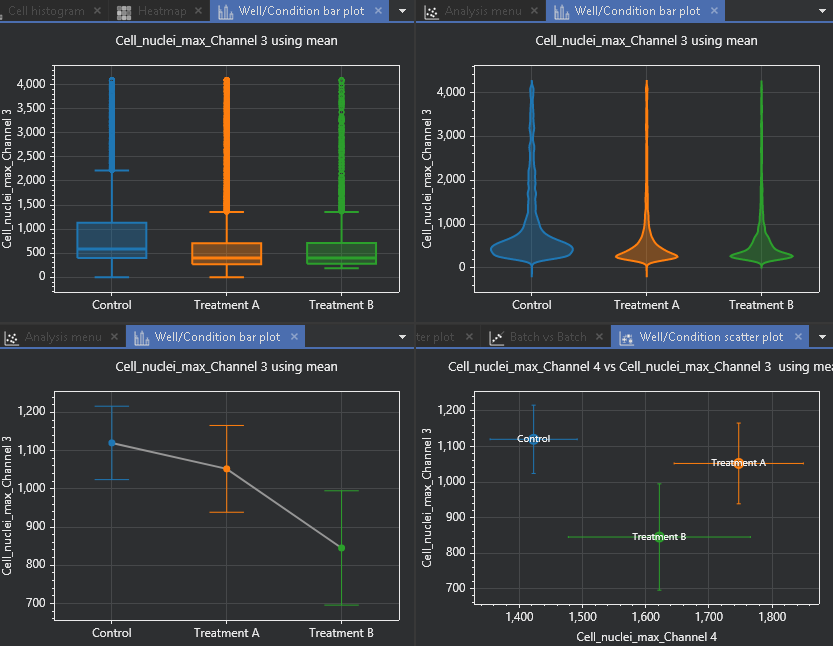
Comparison of experimental conditions across several quantitative plots
From plate to single cell
With AssayScope, screening results stay connected to the biology behind them. Start from the plate heatmap, select the wells that stand out, then drill down to populations, individual cells or organoids and the original images. Build populations with interactive gating on any combination of features, compare conditions with multiparametric plots, and export aggregated statistics per well, condition or plate.
Hit selection in the plate heatmap and validation in the image viewer
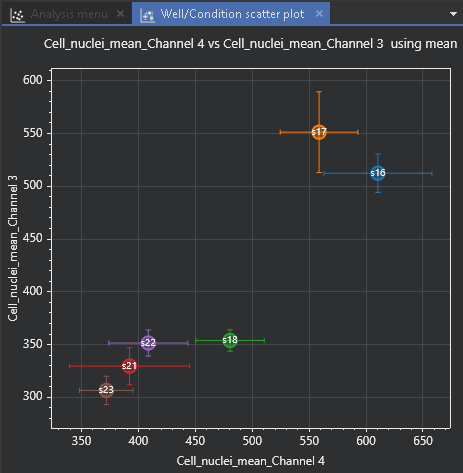
Well-to-well variability across experimental conditions
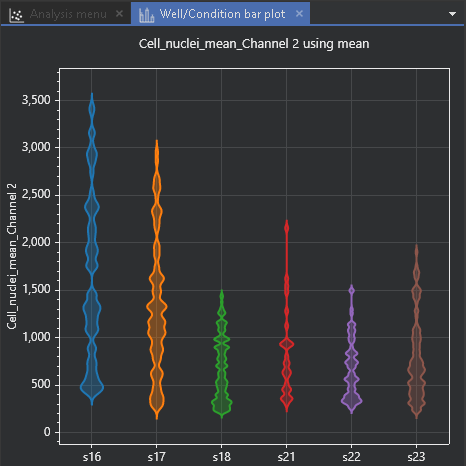
Violin plots comparing conditions on a quantitative feature
Two ways to work with QuantaCell
Analyze your images yourself. AssayScope for cell-based and 3D assays and high-content screening; HistoMetriX for tissue sections from preclinical toxicology studies. Both run on your computer: your images never leave your laboratory.
Let our experts analyze them. Our 3D organoid image analysis services and histology image analysis services cover screening and toxicology studies end to end, from assay-specific workflow design to quantitative results reviewed with your team. Every project starts with a free feasibility study on up to 5 representative samples. Standard analyses start from €1,500 and advanced projects with custom AI development from €3,000.
Screening research we contribute to
Our team has co-developed high-speed 3D imaging and analysis pipelines for organoid cultures with multi-scale phenotypic quantification (Nature Methods, 2022 and 2025), published quantitative imaging methods for mitochondrial morphology in cellular health and environmental toxicity studies (Comput Struct Biotechnol J, 2023; PLOS ONE, 2024), and contributed to an RNAi screen revealing the signaling network that controls the Golgi apparatus (Molecular Systems Biology, 2012). We also develop deep learning methods for 3D light-sheet imaging of pulmonary fibrosis within the ANR FIRE project.
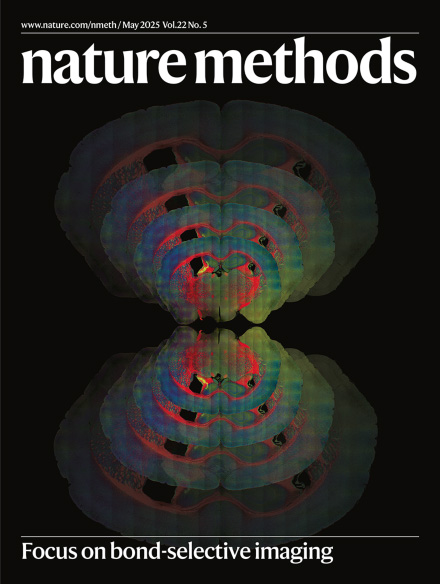
Nature Methods cover, May 2025
FAQ
Which high-content imaging systems are supported?
AssayScope imports data from systems such as Opera Phenix, Operetta CLS, ImageXpress and CellVoyager, as well as Evident and ZEISS systems, and supports custom plate layouts.
Can you analyze 3D models in screening format?
Yes. Spheroids and organoids are segmented in 3D in every well, and results are aggregated per well, condition and plate.
Do you calculate dose-response curves?
Yes. Readouts can be compared across doses and conditions, normalized to controls and summarized as dose-response curves and IC50 or EC50 values.
Can you analyze tissue sections from toxicology studies?
Yes, with HistoMetriX or our histology services: necrosis, inflammation, fibrosis, steatosis and organ-specific structures.
Do my images leave my laboratory?
Not with AssayScope or HistoMetriX, which run locally. For service projects, you share your images through our dedicated Nextcloud server, or through the platform of your choice: OneDrive, Google Drive or your organization’s own file-sharing service.
Is this for diagnostic use?
No. Our software and services are intended for research use only.
Planning a screen or a toxicology study?
Send us a few representative images or a test plate: we will assess feasibility for free and recommend the best workflow, software or service.