Simplify your histological
analyses with
HistoMetriX


Why choose
HistoMetriX?
Powered by the most advanced deep learning technology, HistoMetriX makes it easy to discover valuable information and visualize results without the need for in-depth technical expertise.
With HistoMetriX, you can easily navigate through complex datasets, detect and analyze tissue structures, and extract meaningful information in just a few clicks.
HistoMetriX optimizes workflows, automates tasks, and offers effective analysis tools, allowing you to save valuable time and resources.

-
Performance
Analyze multiple slides and quickly visualize the results -
Easy to use
A software that requires no technical skills, featuring a guided interface and compatible with various slide scanners -
Versatility
A software that adapts to various fields of research & industry (tissue & cellular structures, wide range of measurement & analyses, ...) -
Security
No cloud. As a result, no images or data leave your laboratory for optimal data security -
Our customer support
At QuantaCell, our clients are partners, and we are committed to supporting them in their adoption of HistoMetrix
HistoMetriX: the histology and histopathology software
to simplify your tissue analysis
Once your histological slides have been digitized, you will be able to:
- Detect nuclei, cells, and tissue structures
- Perform morphometric and spatial biology analyses
- Count cells and/or identify specific cell types
- Analyze TMAs (Tissue MicroArrays)
- Conduct colocalization and multiplex analyses
And
- Train your Deep Learning models
- Visualize your results in-depth with image-linked graphs
Or
- Run a ready-to-use analysis pipeline to obtain your results even faster.
-
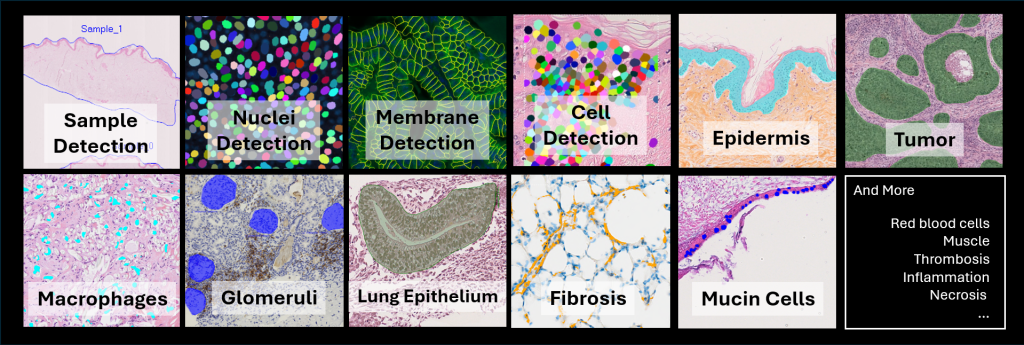
Detection of nuclei
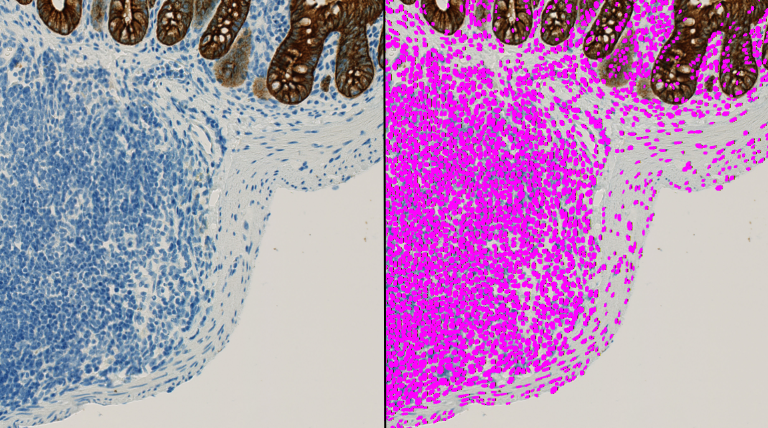
Detection of nuclei exhibiting different densities
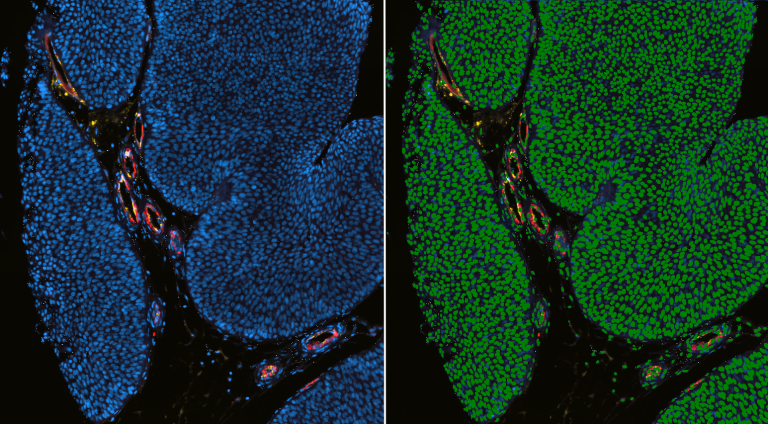
Nuclei detection with fluorescence staining (DAPI)
-
Detection of a membrane
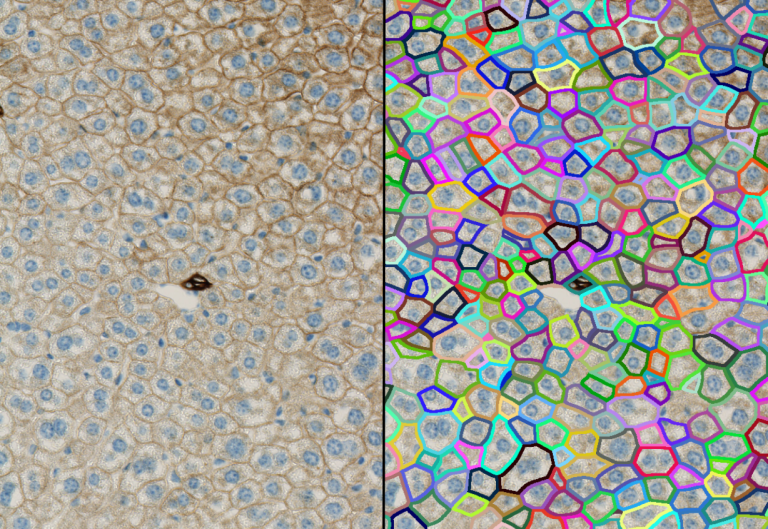
Membrane detection in brightfield condition
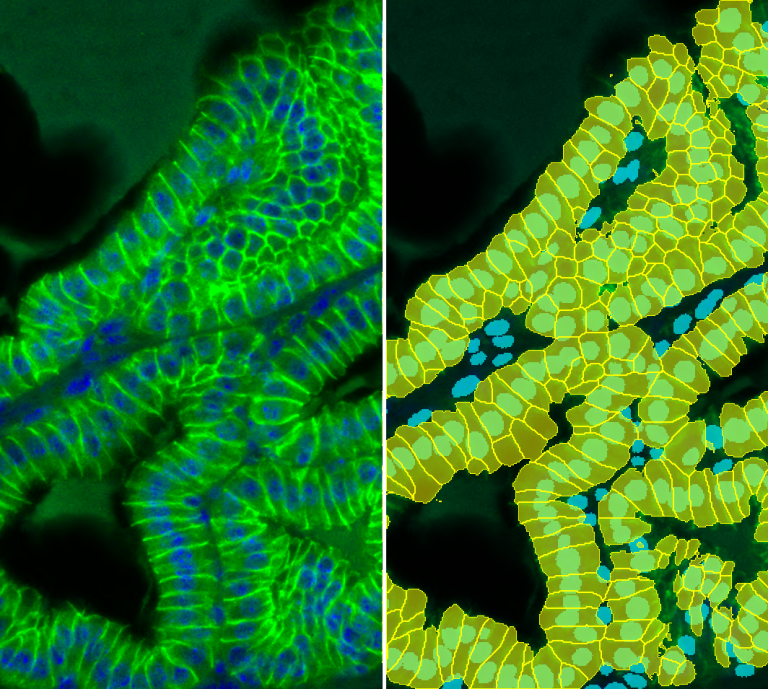
Membrane detection in fluorescence condition
-
Detection of tissue
Detection of epidermis under various brightfield stainings with one deep learning model
Detection of tumor areas
-
AI training & pre-trained model
HistoMetriX offers the possibility to train or integrate AI models to improve segmentation or classification depending on the experimental context.
AI Features:
- Use of pre-trained models: nucleus detection (e.g., Stardist), membrane detection. (e.g., Cellpose), tissue structure detection (e.g., epidermis, etc.).
- Training of custom deep learning models for tissue structure detection (U-Net architecture) from annotated datasets.
- Adapted to various tissue structures: tonsil, lymph node, spleen, etc.
- Reuse of validated models to standardize analysis across projects.
Overview of pre-trained models
-
Cell classification
HistoMetriX enables the creation and classification of cell populations, combining threshold-based approaches with automated clustering methods.
Methods used:
- Manual classification using thresholds (intensity, area, etc.).
- Automated clustering, where users can define relevant features (intensity and/or morphometric parameters) and guide the clustering process as needed.
Manual classification using thresholds
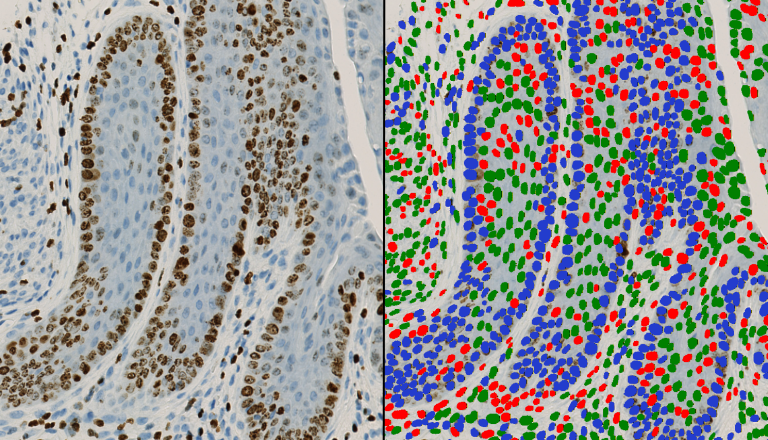
Nuclei detection and classification (red and green), DAB segmentation (blue)
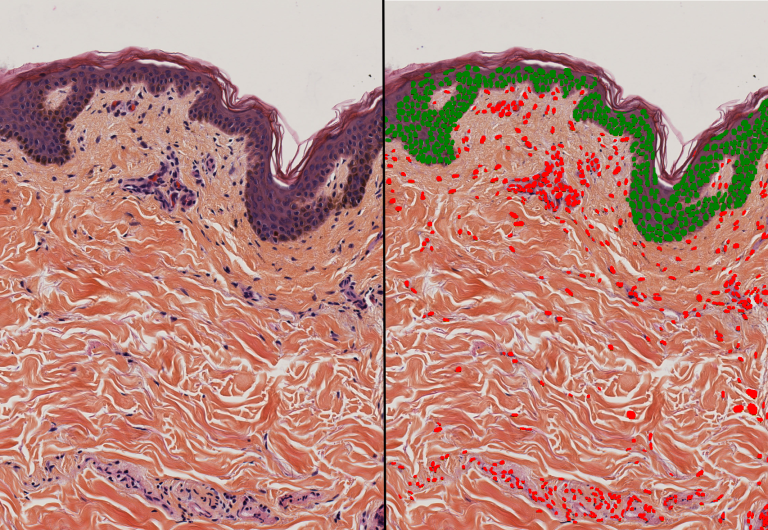
Classification of nuclei in epidermis (green) and dermis (red)
Automated classification
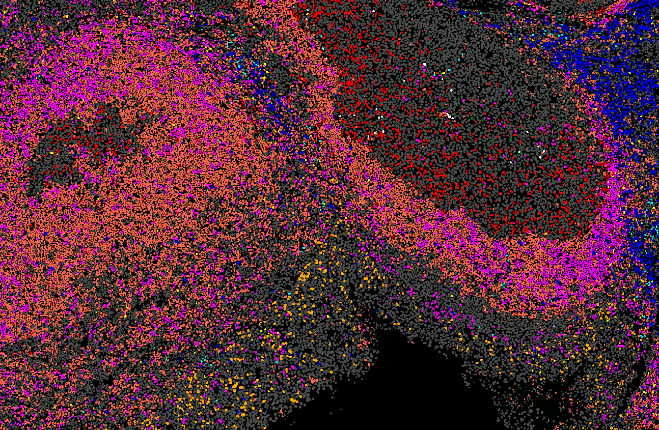
Example of cell clustering and classification (example for 10 cell types : B cell, T helper, …)
-
Quantification & Spatial Analysis
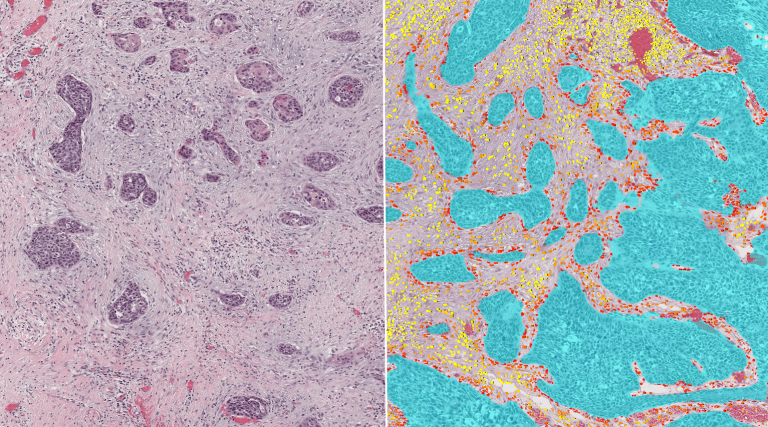
Distance of cells associated with the tumor microenvironment, represented by a red-to-yellow gradient from closest to farthest cells
HistoMetriX includes tools dedicated to the quantitative analysis of spatial biology, enabling precise measurement and characterization of cellular organization within tissues. These tools allow not only the study of spatial relationships between cell populations—essential for immunological and tumor analyses—but also the robust quantification of multiple biological parameters.
Available analyses:
- Quantification of cell populations through automated cell counting and classification.
- Calculation of intercellular and interpopulation distances (see image 5), providing quantitative assessment of spatial proximity and interaction patterns.
- Calculation of local or cell type–specific cell density in user-defined regions (ROIs, follicles, tumor areas, etc.), enabling measurement of infiltration gradients or regions of cell accumulation.
- Quantification of labeled areas and tissue compartments (area measurement, thickness, length, roundness, morphology descriptors).
- Measurement of marker intensity at the single-cell or regional level, allowing quantitative assessment of protein expression levels.
- Co-localization analysis with quantitative metrics (overlap coefficients, proximity measurements), enabling objective evaluation of marker co-expression.
- Spot detection and quantification, including counting and intensity measurement of subcellular signals.
HistoMetriX therefore provides a comprehensive framework for spatial and quantitative analysis, combining morphological, spatial, and molecular measurements to support reproducible and data-driven biological interpretation.
Visualization and exploration of results :
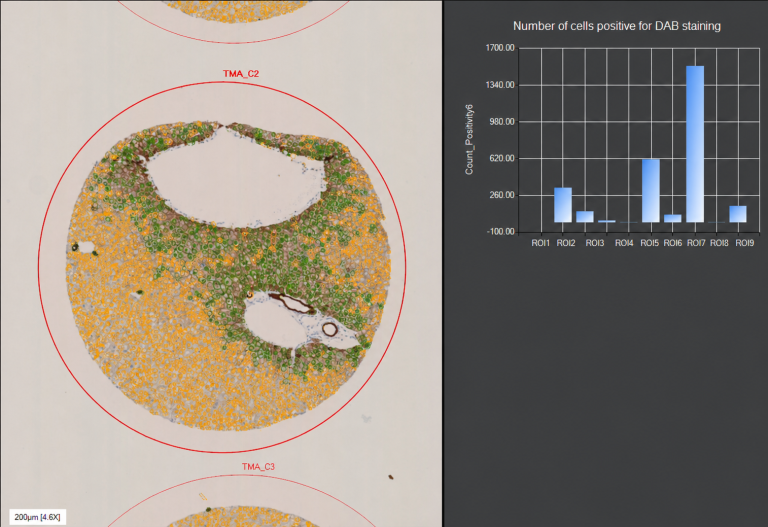
Visualization of the results on a ROI
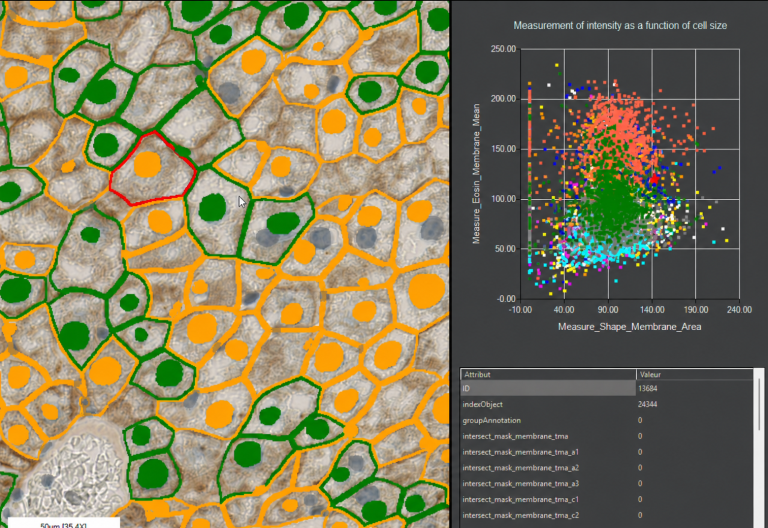
Visualization of the results on a detected object
Try HistoMetriX for free with your own data!
Request a trial versionDiscover our quantitative histological image analysis service
Discover the service