CASE STUDY · BRIGHTFIELD IHC · RUO
Automated Ki67 Scoring
with HistoMetriX
Set up in minutes. Results in seconds. Same answer every time.
Manual Ki67 counting takes a mean of 17 minutes per case when done rigorously — and eyeball estimation, though faster, misclassifies tumor grade in up to 45% of cases¹. HistoMetriX automates the entire process with no configuration required. For research use only.
¹ Cottenden et al., Arch Pathol Lab Med, 2018. PMID: 29293020

12 sec
per 1 mm² region (4,500 cells)
3 min 45
per 1 cm² region (281,764 cells)
100%
reproducible, run to run

How HistoMetriX works
No parameters to configure.
1
Upload your batch of slides
Drag and drop your entire slide cohort into HistoMetriX in one go.
Supported formats: SVS, NDPI, TIFF, MRXS. Browser-based — no installation, no plugin. Process one slide or an entire study at once.
2
Select the Ki67 pipeline — that’s it
HistoMetriX automatically segments nuclei, separates DAB-positive cells (Ki67+) from
hematoxylin-stained cells (Ki67−), and computes the proliferation index. Choose your region mode (see below) and let the pipeline run across your entire batch.
3
Explore and export your results
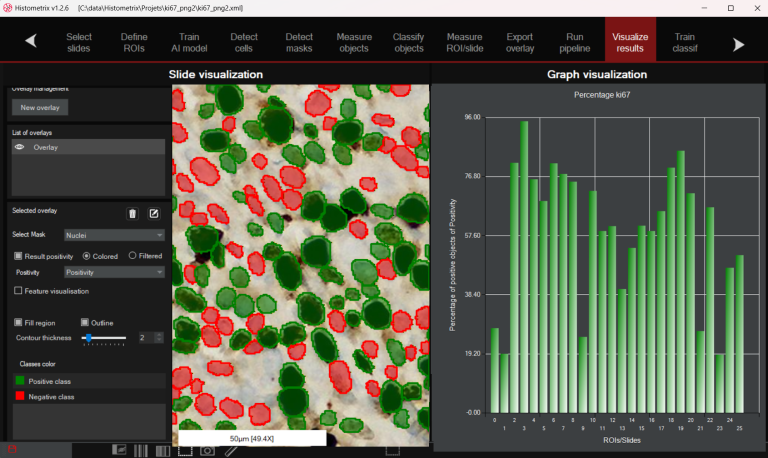
Navigate results directly in HistoMetriX — zoom into detections, inspect individual nuclei, distance map overlay.
Export your full cohort data as CSV for downstream analysis in R, Python, or any statistical tool.

Screenshot — HistoMetriX interface: visualization of ki67 positive cells and visual inspection, parameter adjustment panel
Screenshot — HistoMetriX interface: batch view with multiple slides queued, Ki67 pipeline selected, results panel
Three region modes — you choose the right one for your study
HistoMetriX gives you three options, each suited to a different research context.
1
MODE 1 : Full sample
HistoMetriX automatically detects the tissue on the slide and analyzes everything present — excluding the glass background. Ideal for
homogeneous samples or when you want a global overview with no manual input.
2
MODE 2 : Automatic tumor detection
HistoMetriX identifies the tumor region automatically and restricts the Ki67 analysis to that area only — excluding stroma, necrosis, and non-tumoral tissue. Available for several tissue indications. Contact us to
check compatibility with your tissue type.
3
MODE 3 : Manual ROI
You draw the region of interest directly on the slide viewer. Full control over the analyzed area — useful for targeted sub-region analysis, hotspot scoring, or any case where automatic detection is not applicable.
All three modes are available today and can be combined within the same batch:
different slides can use different region modes in a single run.

Mode 1: Whole sample detection in blue

Mode 2: User has defined a UserROI in red

Mode 3: A tumour detection is applied in the UserROI
What you get
The global percentage of Ki67-positive nuclei across the analyzed region — per slide, and
aggregated across your entire batch for cohort-level analysis.
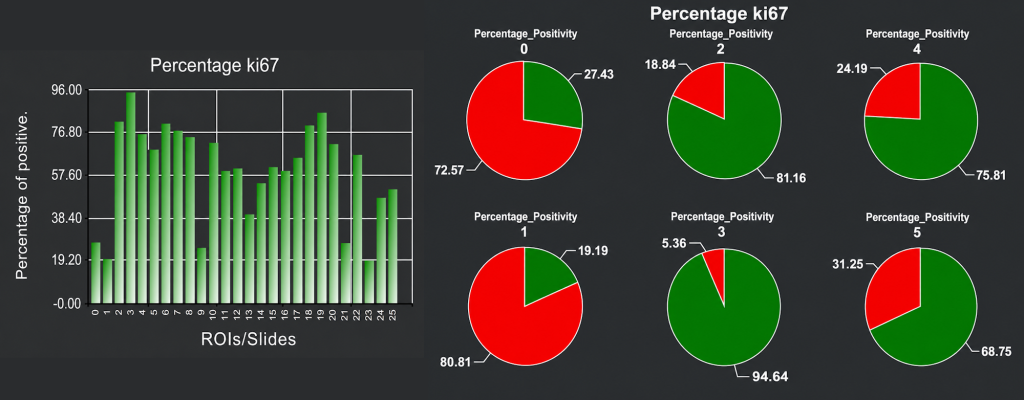
Screenshot of the HistoMetriX results page. The percentage of ki67% in displayed as bar chart and pie charts. The user can double click on chart to see corresponding slide with overlap to review the data and do quality control
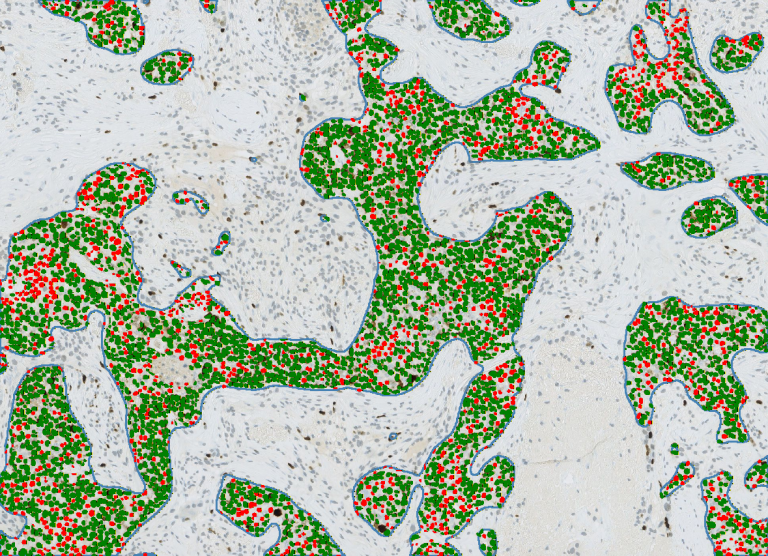
Every detected nucleus is classified and displayed directly on your slide. Ki67-positive nuclei are shown in green, Ki67-negative in red. Detection robustness was benchmarked against expert annotations from the BCData test set (26 images, MICCAI 2020). HistoMetriX achieved a cell
detection ratio of 1.01 vs ground truth, with a Pearson correlation of r = 0.91 on Ki67-positive cell count and r = 0.82 on Ki67-negative cell count, across the full range of proliferation rates (13% to 82%).

Screenshots — close-up of detected nuclei: green (Ki67+) and red (Ki67−) overlaid on brightfield tissue
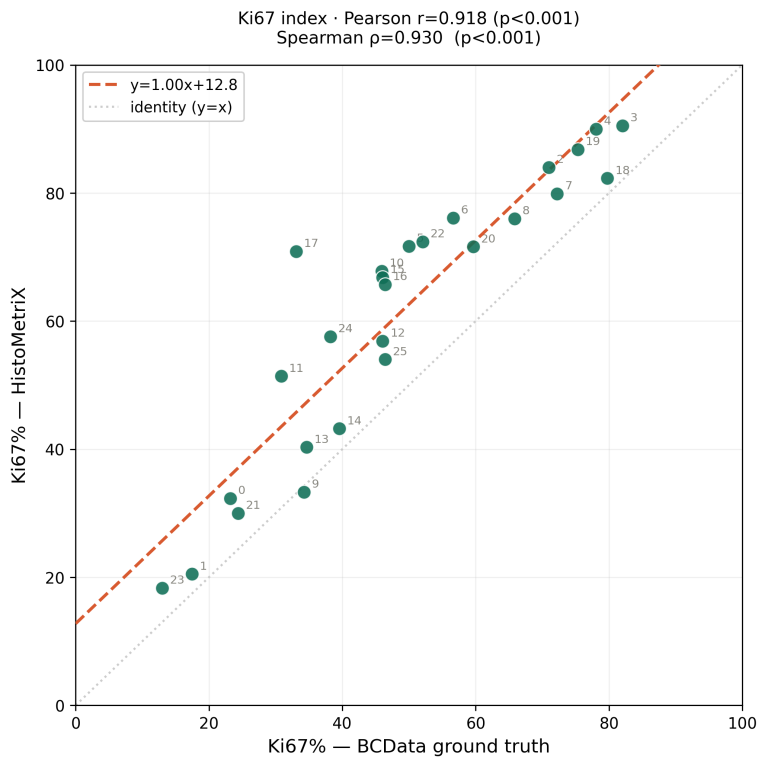
Fig. 1 — Ki67 index correlation: HistoMetriX vs BCData ground truth (n=26, Pearson r = 0.918)
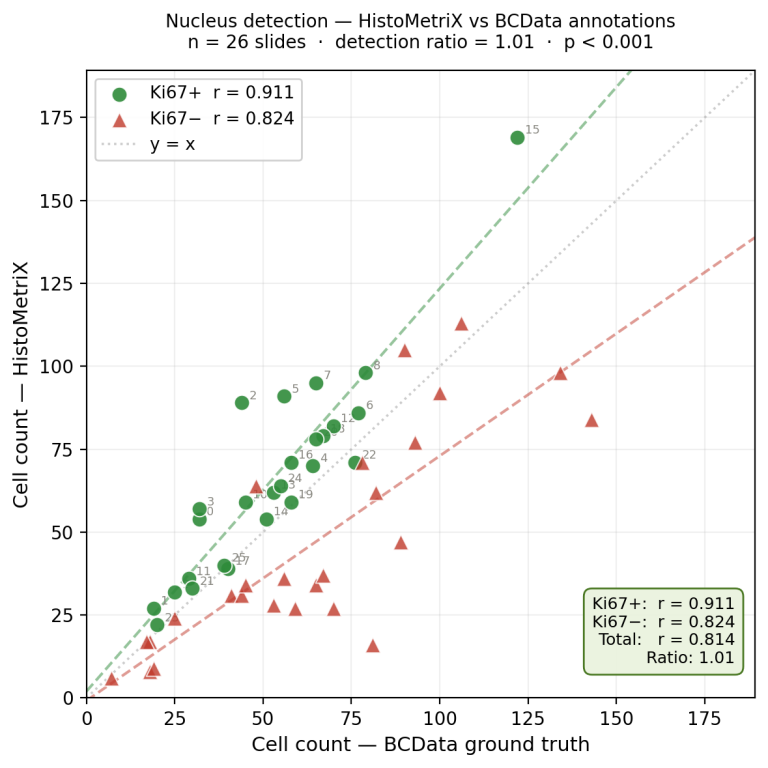
Fig. 2 — Nucleus detection: HistoMetriX vs BCData expert annotations (n = 26). Ki67+ in green (r = 0.911), Ki67− in red (r = 0.824). Detection ratio = 1.01.
Beyond counting nuclei, HistoMetriX computes for each detected cell its distance to the healthy tissue boundary — using the automatic tumor segmentation from Mode 2. Every cell on the slide is color-coded by this distance: cells in healthy tissue and cells at the tumor invasive front
appear in red, while cells deeper inside the tumor mass grade through orange to yellow. This distance map makes the tumor architecture immediately readable at a glance, and reveals the spatial organization of proliferating cells relative to the invasion front.
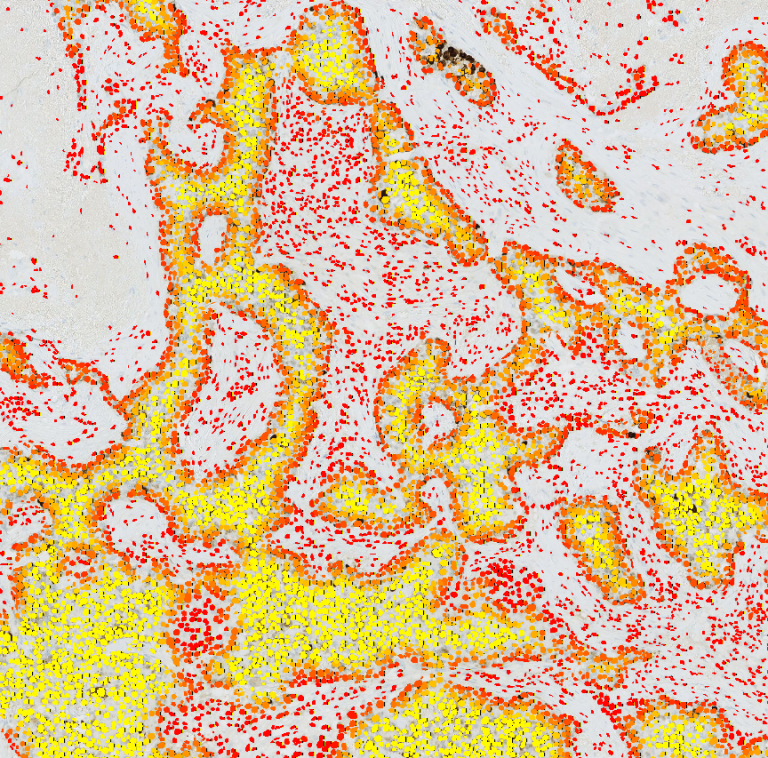
Screenshot — Distance map on a Ki67-stained breast cancer WSI (ACROBAT dataset). Red: healthy tissue / invasive front. Yellow: tumor core. All detected cells shown.
Raw cell-level data exported as CSV: nucleus coordinates, classification (positive / negative),
local density, and summary statistics per slide and per region. Full batch results in a single
export. Ready to load into R, Python, Prism, or Excel.
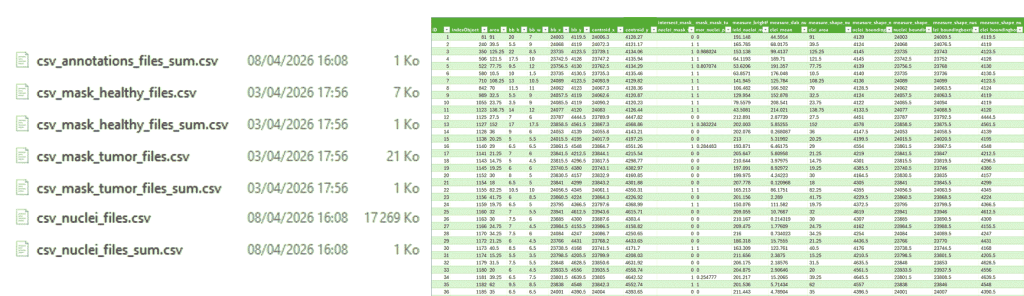
Different csv files are generated and can be displayed in third party software. An example of cells csv loaded in Excel where each line correspond to a single cell
Reproducibility
every time, on every machine, across every slide in your batch.
< 1%
CV intra-run (same slide, repeated)
0
operator variables
Full
analysis metadata per run
Validated on the BCData test set (26 Ki67-stained breast cancer images, MICCAI 2020):
Pearson r = 0.92, Spearman ρ = 0.93 (p < 0.001). Cell detection ratio: 1.01 vs expert annotations.
How fast is HistoMetriX?
12 sec for a 1 mm² region — 4,500 cells detected and classified
3 min 45 for a 1 cm² region — 281,764 cells detected and classified
Benchmark: Ryzen 9 3.70GHz · 64 GB RAM · GeForce RTX 5060 Ti.
Results may vary depending on hardware configuration.
Scientific basis
HistoMetriX is built on established computational pathology methods for DAB/hematoxylin color
deconvolution and nuclear segmentation in brightfield IHC images.
BCData — 26-image test set: Pearson r = 0.918, Spearman ρ = 0.930 vs expert annotations (MICCAI 2020)
• ACROBAT — 4,212 WSIs from 1,153 breast cancer patients, Karolinska Institutet
• Color deconvolution approach consistent with published brightfield IHC quantification methods
HistoMetriX is a research-use only (RUO) tool. It is not intended for clinical diagnosis
or patient management decisions.
Try HistoMetriX for free with your own data!
Request a trial versionDiscover our quantitative histological image analysis service
Discover the service