
APPLICATIONS · DERMATOLOGY & COSMETICS
Skin image analysis for dermatology and cosmetics
From skin biopsies to reconstructed skin models
Skin studies rely on a few key endpoints (epidermal thickness, skin layer organization, collagen, pigmentation, marker expression) that must be measured the same way on every sample. QuantaCell turns your skin histology and microscopy images into objective, reproducible quantitative data, from human biopsies and ex vivo explants to reconstructed skin, 3D cultures and animal models.
Run the analysis yourself with our software, or entrust it to our image analysis experts: we support cosmetics, pharma and academic teams in efficacy, safety and research studies.

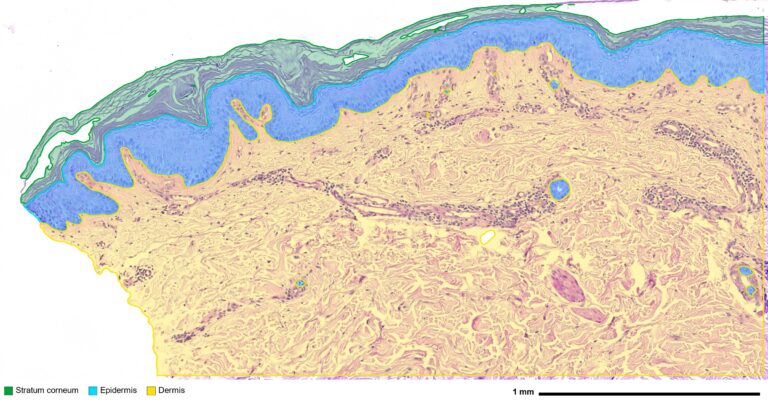

Every skin model, every staining
All skin models. Human skin biopsies, ex vivo skin explants, reconstructed human epidermis and full-thickness skin models, animal models such as mouse skin and mouse ear, and 2D and 3D cultures of skin cells: keratinocytes alone or in co-culture with fibroblasts, melanocytes or immune cells.
Beyond histological sections. We also analyze 3D skin imaging, such as optical coherence tomography (OCT) of the skin, confocal and light-sheet microscopy of skin samples, and 3D stacks of reconstructed skin and skin organoids.
All stainings. H&E, HES, eosin, PAS, Masson’s trichrome, Fontana-Masson, IHC and immunofluorescence. A single deep learning model detects the epidermis across various brightfield stainings, and models can be retrained on your own annotations when your protocol is specific.
All analysis designs. Analyze the full tissue, let HistoMetriX detect each sample on multi-sample slides, or position standardized fields along the epidermis, for example in 10-field protocols. Each slide in a batch can use its own mode.
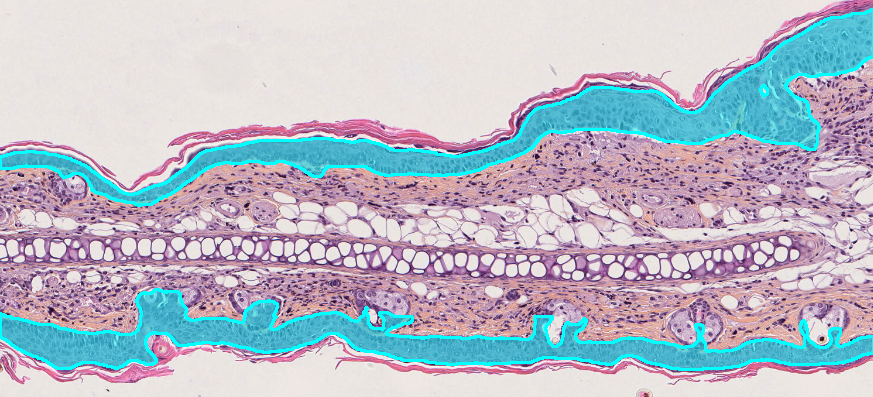
Epidermis detection on a mouse ear cross-section
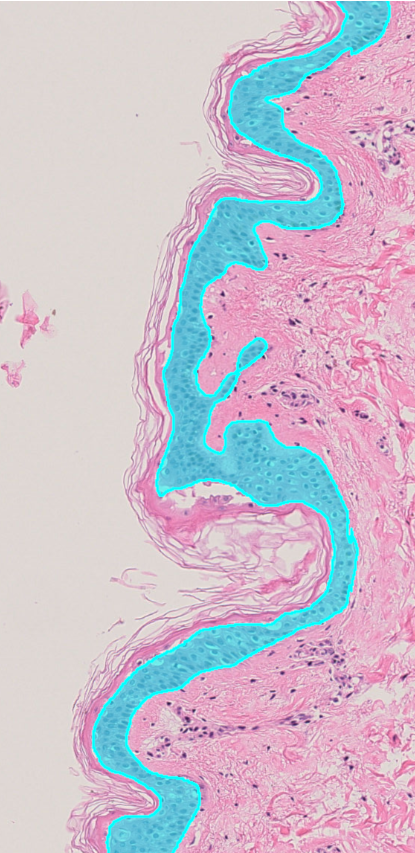
H&E
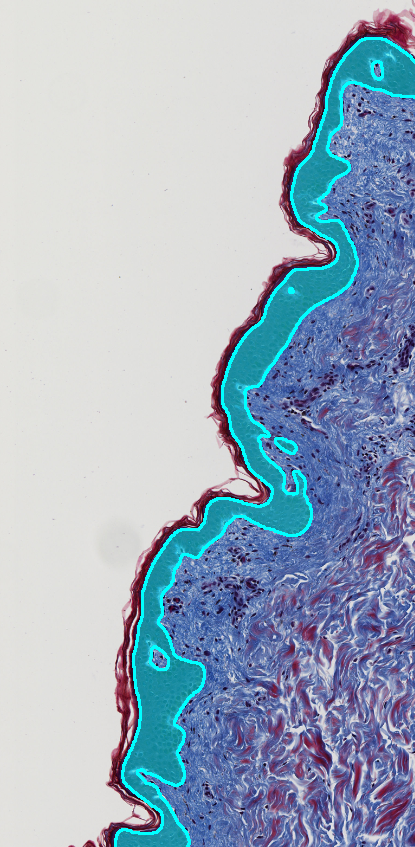
Masson’s trichrome
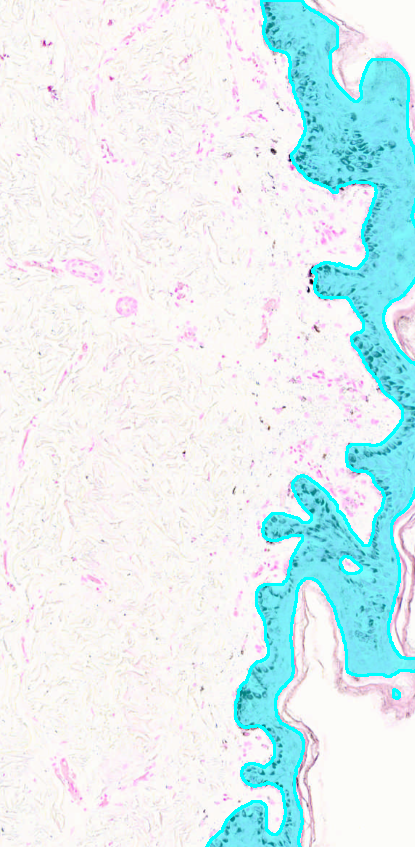
Fontana-Masson
What we measure in skin
Skin compartments. Automatic segmentation of the stratum corneum, viable epidermis and dermis, with area measurements for each compartment.
Epidermal thickness and morphology. Mean and median thickness, epidermal midline length and dermal-epidermal junction length, to characterize epidermal thickening or thinning, junction undulation and rete ridge flattening.
Cells and biomarkers by compartment. Nuclei detection in the epidermis and dermis, marker-positive and marker-negative cells on IHC, and cell density and positivity reported separately for each compartment.
Dermal matrix. Collagen and fibrosis quantification and organization in the dermis.
Pigmentation. Melanin detection and quantification, for example on Fontana-Masson staining.
Spatial analysis. Distances of cells and structures to the epidermis, and distribution of cells across skin layers.
Custom AI models. Dedicated deep learning models for specific skin structures, from hair follicles to vacuolated cells.
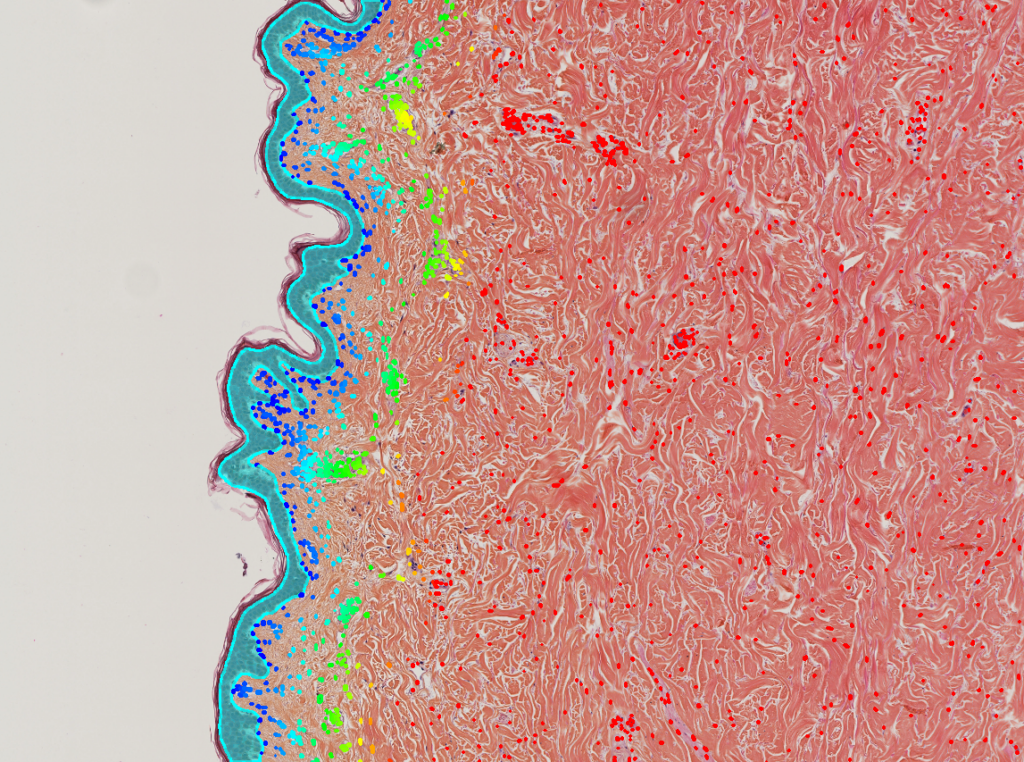
Distance of detected nuclei to the epidermis
Skin readouts we deliver
Epidermis and skin structure. Stratum corneum, viable epidermis and dermis areas, mean and median epidermal thickness, dermal-epidermal junction length and undulation, rete ridges, number of epidermal cell layers, stratum corneum thickness and detachment.
Epidermal biology. Proliferation (Ki67), differentiation markers (filaggrin, loricrin, involucrin, keratins), apoptosis and sunburn cells, vacuolization, DNA damage after UV exposure (CPD, γH2AX).
Dermis and extracellular matrix. Collagen density and organization (Sirius red, Masson’s trichrome), elastic fibers, glycosaminoglycans, fibroblast density, dermal thickness, microvessel density.
Pigmentation. Melanin content and distribution (Fontana-Masson), melanocyte density and position along the basal layer.
Inflammation and immunity. Immune cell infiltration in epidermis and dermis, mast cells, inflammation scoring in models of atopic dermatitis, psoriasis or irritation.
Skin appendages and repair. Hair follicles and hair cycle stages, sebaceous glands, wound healing and re-epithelialization.
Skin cells and 3D models. 2D and 3D cultures and co-cultures of keratinocytes, fibroblasts, melanocytes and immune cells, reconstructed epidermis and skin organoids, 3D segmentation of cells and nuclei, mitochondrial morphology and cellular health, high-content screening of actives.
3D skin imaging. Optical coherence tomography (OCT): epidermal thickness and skin layer measurements in 3D; confocal and light-sheet microscopy of skin samples and reconstructed skin.
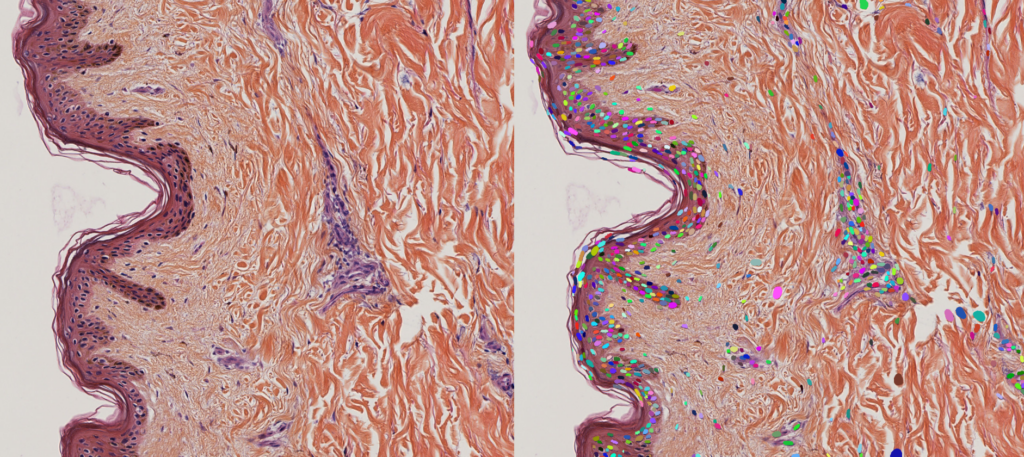
Original skin section and individual nuclei detected by HistoMetriX
For cosmetics, pharma and research
1
Cosmetics
Assess anti-aging, barrier-repair, soothing, whitening or photoprotection actives with objective histological endpoints, measured identically on every sample.
2
Pharma
Quantify skin changes in disease models, efficacy and safety studies, with results comparable across batches and studies.
3
Research
Deliver reproducible whole-slide skin morphometry across samples, models and experimental conditions.
Two ways to work with QuantaCell
Analyze your images yourself. HistoMetriX includes a ready-to-use Skin Morphology pipeline: it detects each sample, segments the stratum corneum, epidermis and dermis, then measures epidermal length and thickness, cell counts and marker positivity. Results are exported as CSV tables for R, Python or Excel. HistoMetriX runs on your computer: your images never leave your laboratory.
For 2D and 3D cultures of keratinocytes and co-cultures, reconstructed skin stacks and OCT volumes, AssayScope brings 2D/3D segmentation, multiparametric quantification and high-content screening.
Let our experts analyze them. Our histology image analysis services and 3D image analysis services cover skin studies end to end, from workflow design to quantitative results reviewed with your team. Every project starts with a free feasibility study on up to 5 representative samples. Standard analyses start from €1,500 and advanced projects with custom AI development from €3,000.
Case study: automated skin layer segmentation
HistoMetriX was evaluated on a public dataset of expert-annotated skin sections (DERMA-PASeg). The automated measurements closely match the experts, while saving hours of manual contouring. Read the skin case study
3.5%
median error on epidermal thickness vs expert annotations
r = 0.994
Pearson correlation for mean epidermal thickness
3-5 min
per cm² to segment the 3 skin compartments
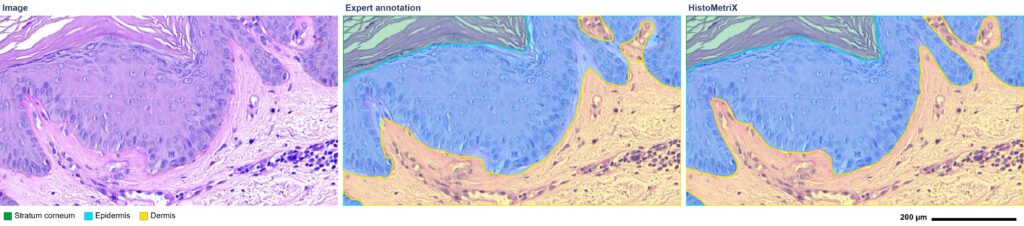
PAS-stained skin section, expert annotation and HistoMetriX segmentation
Skin research we contribute to
Our computational histology work has been published in peer-reviewed journals, including a study showing that applying insect repellent together with sunscreen impairs UV protection in an ex vivo human skin model (Parasites & Vectors, 2025), based on deep learning histology image analysis and nuclear morphometry. Our team has also published quantitative imaging methods for mitochondrial morphology, relevant to cellular health and environmental toxicity studies (PLOS ONE, 2024; Comput Struct Biotechnol J, 2023).
FAQ
Which skin models can you analyze?
Human biopsies, ex vivo explants, reconstructed epidermis and full-thickness skin, animal skin, and 2D and 3D cultures and co-cultures of keratinocytes and other skin cells.
Can you analyze 3D skin images, such as OCT?
Yes. Beyond histological sections, we analyze OCT volumes, confocal and light-sheet stacks, and 3D images of reconstructed skin and skin organoids.
Which stainings are supported?
Brightfield stainings such as H&E, HES, eosin, PAS, Masson’s trichrome and Fontana-Masson, as well as IHC and immunofluorescence. Models can be adapted to your own protocol.
Can you follow our standardized field protocol?
Yes. You can place identical fields along the epidermis (for example 10 fields per slide), and results are reported per field and averaged per slide.
Do my images leave my laboratory?
Not with HistoMetriX, which runs locally with no transfer to the cloud. For service projects, you share your images through our dedicated Nextcloud server, or through the platform of your choice: OneDrive, Google Drive or your organization’s own file-sharing service.
Is this for diagnostic use?
No. Our software and services are intended for research use only.
Have a skin study to analyze?
Send us a few representative slides: we will assess feasibility for free and recommend the best workflow, software or service.