
BRIGHTFIELD HISTOLOGY · RUO
Automated Segmentation of Skin Layers
AI-powered identification and quantification of skin tissue compartments
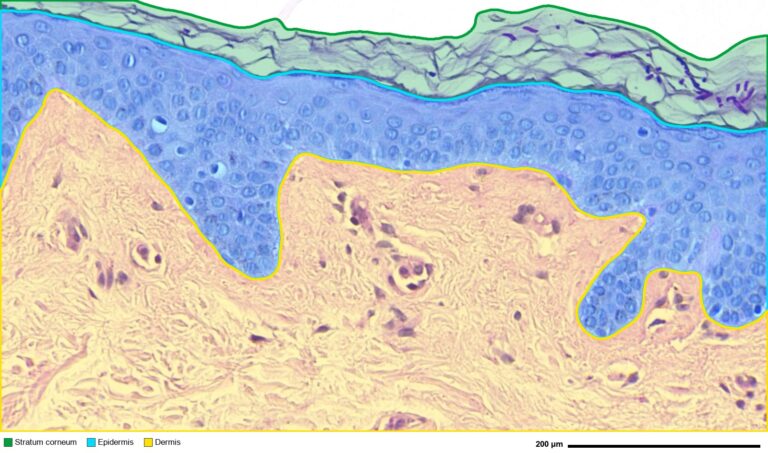
A custom HistoMetriX workflow automatically segments the stratum corneum, viable epidermis and dermis. The resulting color-coded compartments enable reproducible, compartment-specific quantitative measurements across histological sections.

3-5 min
per cm² for automated skin compartment segmentation
3
skin compartments automatically segmented
< 4%
median relative error in epidermal thickness vs expert annotation (public dataset)

Who is it for?
Epidermal thickness and skin compartment metrics are core endpoints across very different fields. HistoMetriX is built for teams who need them on many samples, measured the same way every time.
Cosmetics
Assess anti-aging, barrier-repair and soothing actives.
Pharma
Quantify skin changes in disease, efficacy and safety studies.
Research
Deliver reproducible whole-slide skin morphometry across samples and batches.
How to measure epidermal thickness in 3 steps
From whole slide images to epidermal thickness values, with no contour to draw and no model to train to get started.
1
Load your skin slides
Open a single slide or a complete study in HistoMetriX. Whole slide images in SVS, NDPI, TIFF and MRXS formats are supported.
2
Run the Skin Morphology pipeline
HistoMetriX detects each sample, segments the stratum corneum, epidermis and dermis, then measures epidermal length and thickness, cell counts and marker positivity.
3
Review, then export
Check the segmentations and thickness maps, review any sample from the results plots, and export the measurements per sample or per field.
Analysis regions: full tissue, multiple samples or standardized fields
Skin study protocols do not all sample the tissue in the same way. HistoMetriX lets you define the analyzed area to match your protocol.
1
Full tissue
HistoMetriX automatically detects the tissue and analyzes everything on the slide as one region, excluding the glass background. Ideal for a global overview with no manual input.
2
Automatic sample detection
When a slide contains several skin samples, HistoMetriX detects and labels each one automatically. Results are reported per sample, and outlines can be adjusted before analysis.
3
Standardized fields (manual ROI)
Draw one ROI, duplicate it and position identical fields along the epidermis. Results are reported per field and averaged per slide. Ideal for standardized 10-field protocols.
Each slide in a batch can use its own analysis mode, allowing multi-sample slides and standardized fields to be processed in the same run.
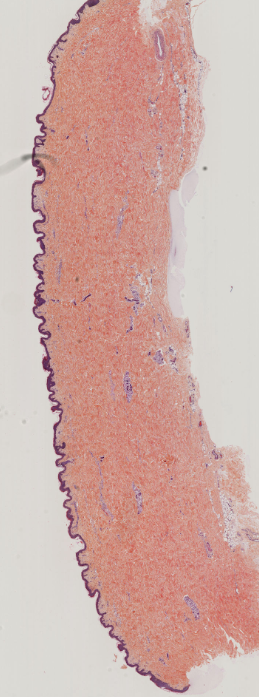
Full tissue analysis without a region of interest
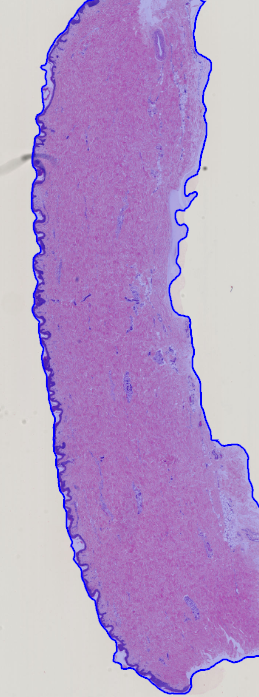
Automatically detected analysis region
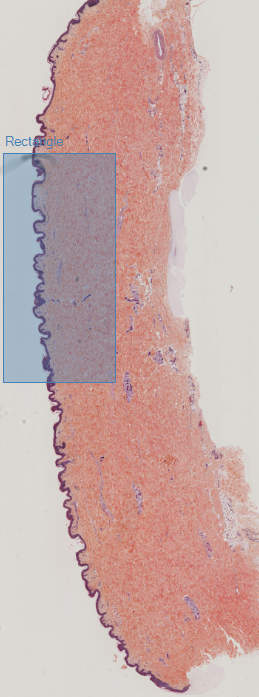
Manually defined analysis region
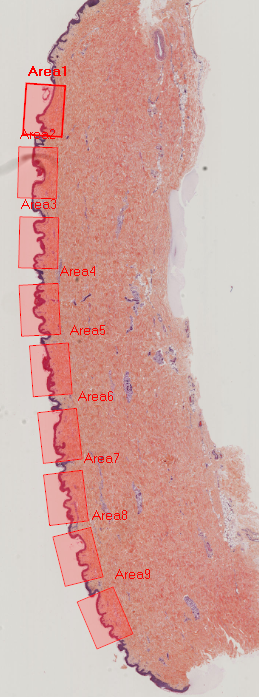
Standardized analysis using 10 identical fields
Epidermis, dermis and stratum corneum metrics
Every analysis produces measurements at the sample, field and batch level, all linked back to the source image.
HistoMetriX automatically segments the stratum corneum, viable epidermis and dermis. The resulting overlays can be reviewed directly on the slide before measurements are exported.
Automatic segmentation of the stratum corneum, epidermis and dermis
© QuantaCell
HistoMetriX quantifies epidermal morphology at the object, field, sample and batch levels. For each segmented epidermal object, the software reports its area, epidermal midline length, dermal-epidermal junction length, and skeleton-based width measurements, including mean and median thickness.
Mean epidermal thickness can also be calculated by dividing the epidermal area by either the epidermal midline length or the dermal-epidermal junction length. Both values are retained because the junction follows rete ridges and dermal papillae and is therefore generally longer than the epidermal midline.
Comparing these measurements helps characterize epidermal thickening or thinning, junction undulation and rete ridge flattening. Results remain linked to the source image: selecting a point in the scatter plot immediately displays the corresponding object on the slide, making outlier review and quality control straightforward.
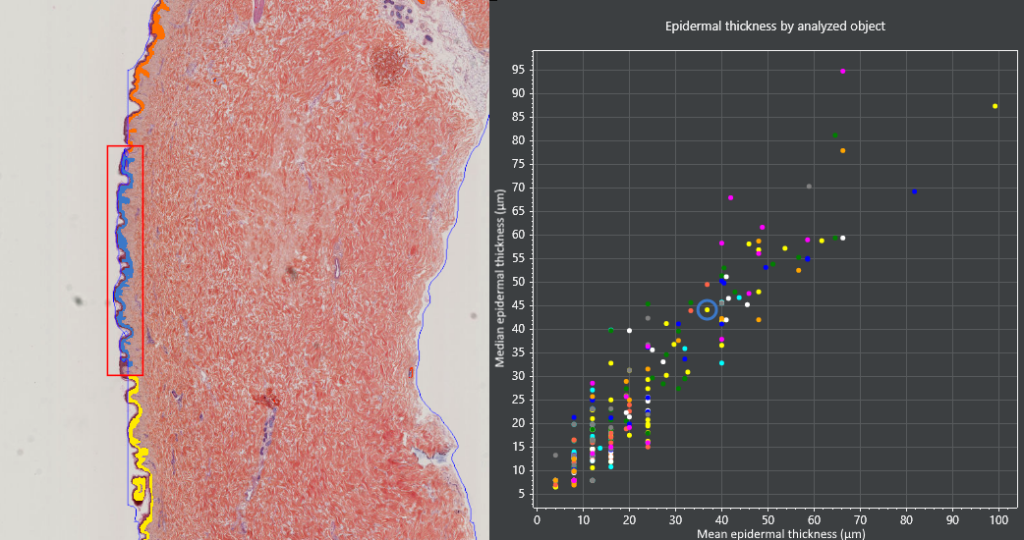
Each point represents one segmented epidermal object. The selected point is highlighted in blue, while the corresponding region is displayed on the slide for immediate visual review.
Beyond morphological measurements, HistoMetriX detects cells within the epidermis and dermis. On IHC slides, cells can be classified as marker-positive or marker-negative, allowing cell density and marker positivity to be quantified separately in each compartment.
Results are available per object, field, sample and batch. This makes it possible to compare treated and control conditions while preserving the spatial context of each measurement.
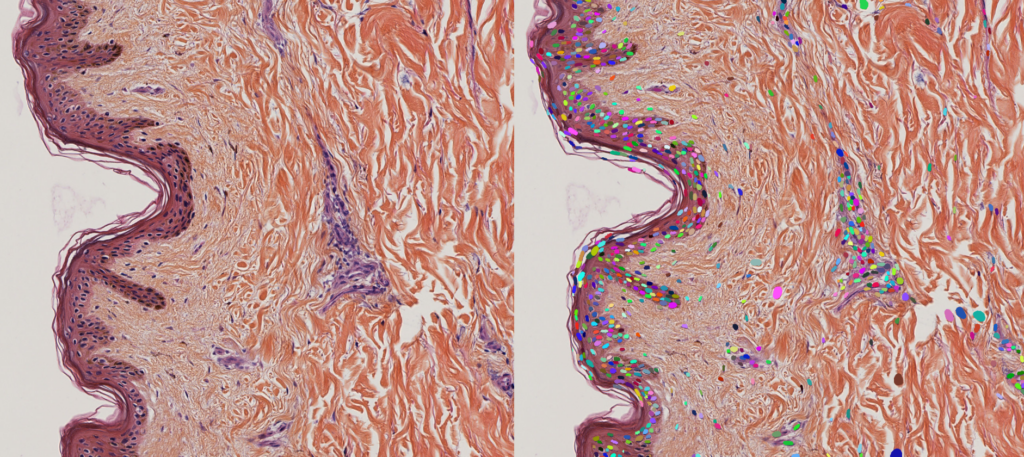
Side-by-side view of the original skin section and individual nuclei detected by HistoMetriX. Each color identifies a separate detected nucleus.
© QuantaCell
Measurements remain linked to the source image throughout the analysis. Results can be explored as interactive plots, with one point representing each analyzed object, field or sample.
Selecting a point immediately highlights the corresponding region on the slide. This makes it easy to inspect individual measurements, identify outliers and verify the segmentation before exporting the data.
Original brightfield image of the skin section before analysis.
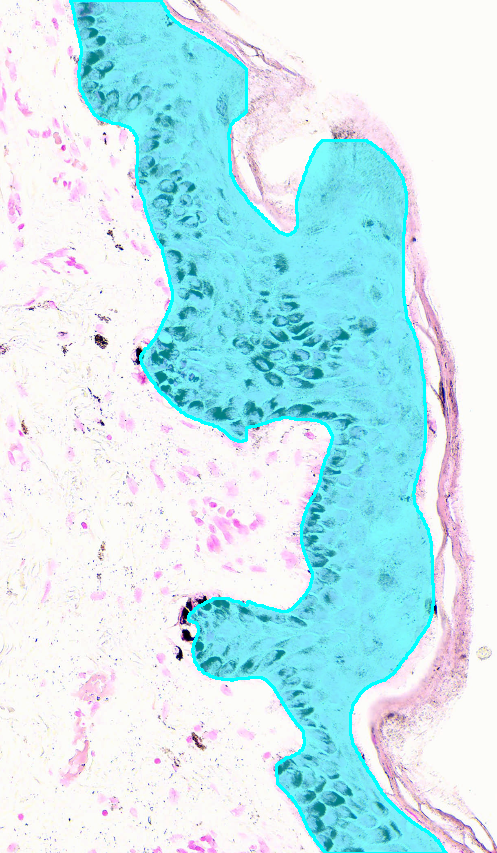
Automatic segmentation of the epidermis within the skin section.
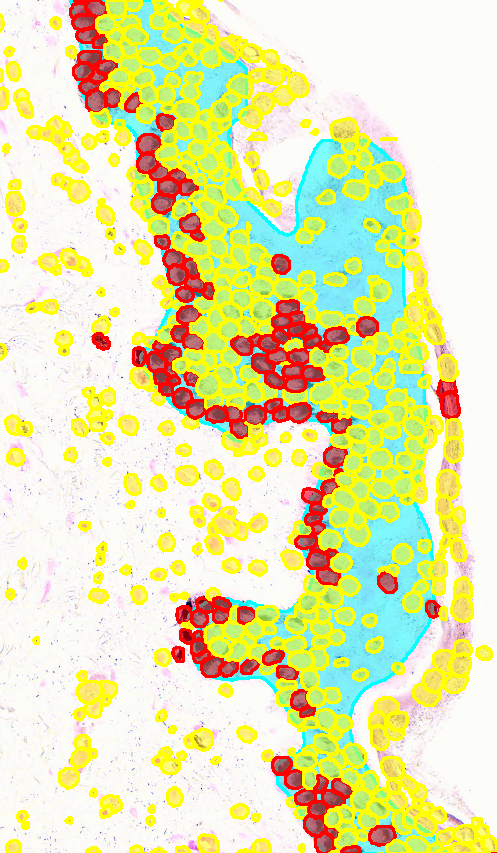
Detected nuclei classified by marker positivity within the epidermis and dermis.
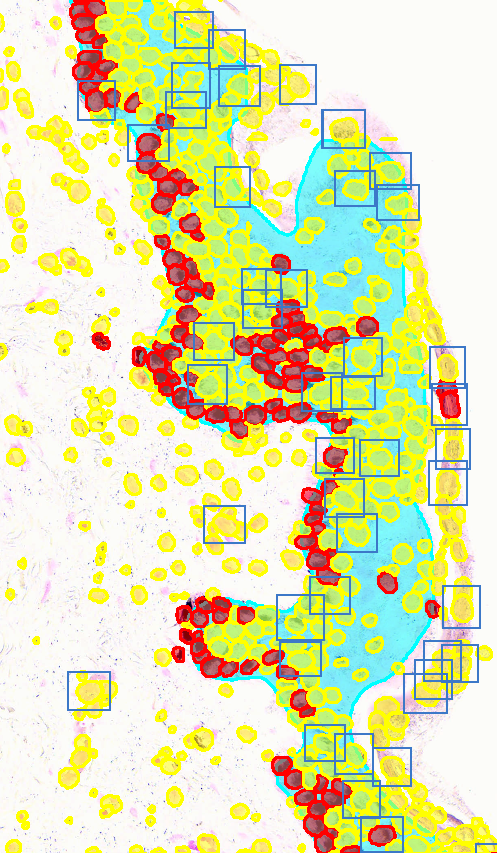
Objects selected in the scatter plot are highlighted in the corresponding region of the source image.
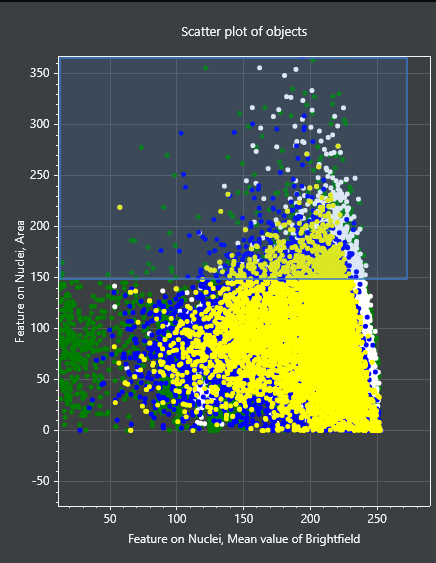
Interactive scatter plot of analyzed objects, with a group of measurements selected for linked visualization.
HistoMetriX exports measurements as structured CSV tables at the object, field, sample and batch levels. Available outputs include compartment areas, epidermal lengths, mean and median thickness, cell counts, densities and marker positivity.
The exported data can be analyzed directly in R, Python, Excel or statistical software to compare experimental groups, identify outliers and generate study-level results
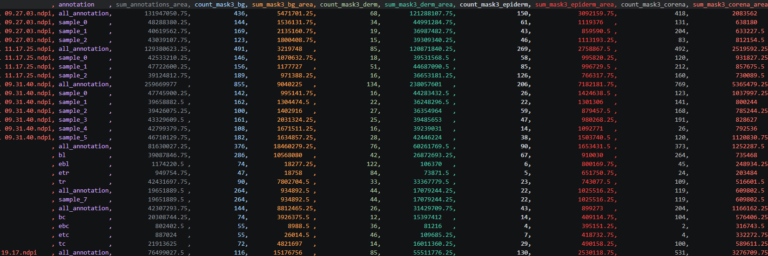
Example of a structured CSV table generated by HistoMetriX, ready for statistical analysis in R, Python, Excel or other software.
Validation on a public dataset
HistoMetriX was evaluated on a publicly available skin histology dataset with expert annotations. Automated epidermal thickness measurements were compared with the reference measurements across the annotated images.
3.5%
median relative error in epidermal thickness compared with expert annotations
0.994
Pearson correlation for mean epidermal thickness
0.94
Dice score for epidermis segmentation
1
32 PAS-stained human skin sections at 0.5 µm/pixel, with expert annotations of the stratum corneum, epidermis, dermal-epidermal junction and dermis. The DERMA-PASeg dataset is publicly available under a CC BY 4.0 license (Salam et al., 2024).
2
The model was trained on 24 annotated slides. Expert masks were converted into three HistoMetriX compartments: stratum corneum, epidermis and dermis. Training took 4 h 40 min on a single 16 GB GPU.
3
The 8 held-out test slides were evaluated at 1 µm/pixel using PPV, sensitivity, Dice and Matthews correlation coefficient. HistoMetriX outputs were scored without post-processing.
Segmentation accuracy was evaluated separately for each compartment using positive predictive value (PPV), sensitivity, Dice score and Matthews correlation coefficient (MCC). Results are reported as mean ± standard deviation, with the median in parentheses, across the 8 test slides.
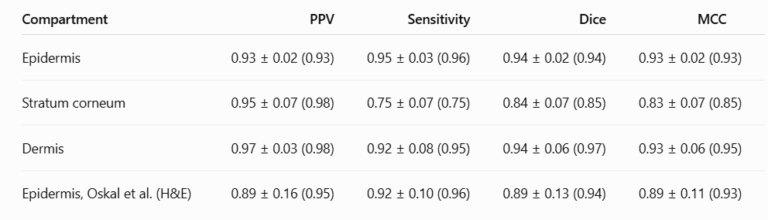
PPV, sensitivity, Dice and MCC for the epidermis, stratum corneum and dermis across the 8 DERMA-PASeg test slides. Values are mean ± standard deviation, with the median in parentheses. The Oskal et al. results are provided as an external protocol comparison.
© QuantaCell. DERMA-PASeg dataset: CC BY 4.0. Oskal et al. (2019).
Three test slides were scored within their predefined regions of interest. Oskal et al. evaluated 33 H&E slides from other laboratories using their own post-processing. This comparison therefore concerns the reported protocols, not identical images.
The epidermis reached a Dice score of 0.94 ± 0.02, with a minimum of 0.92 across the test slides. The stratum corneum was the most challenging compartment because it is thin and frequently detached. Its PPV remained high at 0.95, but some thin fragments were missed, resulting in a sensitivity of 0.75.
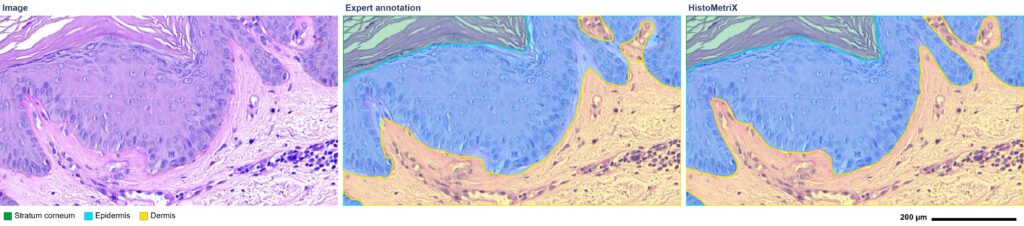
Test slide WC23-00492-A1, 800 × 450 µm field at 0.5 µm/pixel: original PAS image, expert annotation and HistoMetriX segmentation. HistoMetriX separates a dermal papilla that the expert annotation merges into the epidermis.
© QuantaCell. Source image and expert annotation: DERMA-PASeg dataset, CC BY 4.0.
Two measurements were calculated on each test slide using both the HistoMetriX segmentation and the expert masks: the length of the dermal-epidermal junction, corresponding to the epidermis-dermis boundary, and the mean epidermal thickness, calculated as the epidermal area divided by the junction length.
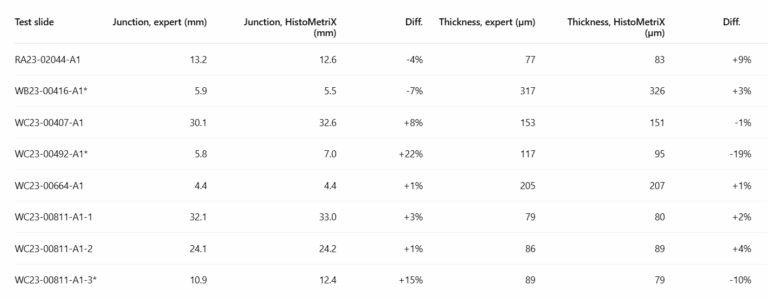
Dermal-epidermal junction length and mean epidermal thickness measured from the expert masks and the HistoMetriX segmentation on the 8 DERMA-PASeg test slides. Asterisks indicate measurements restricted to a predefined region of interest.
© QuantaCell. Source data: DERMA-PASeg dataset, CC BY 4.0.

Bias, absolute error, relative error and Pearson correlation for dermal-epidermal junction length and mean epidermal thickness across the 8 test slides. Values are reported as mean and median.
© QuantaCell. Source data: DERMA-PASeg dataset, CC BY 4.0.
On a typical slide, the junction length is within 5.4 % of the expert masks and the mean thickness within 3.5 % (medians). The means are pulled up by WC23-00492-A1 (junction +22 %, thickness -19 %): a few sweat ducts of its dermis are segmented as epidermis, and each adds its own small ring of junction, which lowers the mean thickness. On the other 7 slides, the junction length differs by at most 15 % and the thickness by at most 10 %.
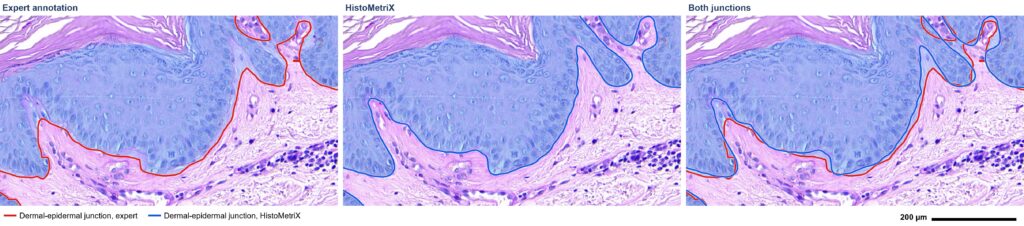
Dermal-epidermal junction on the same field: expert annotation in red, HistoMetriX segmentation in blue and both contours superimposed. The two lines follow the same rete ridges, while HistoMetriX outlines the dermal papillae more closely.
© QuantaCell. Source image and expert annotation: DERMA-PASeg dataset, CC BY 4.0.
Analysis time was measured from the start of the pipeline to the writing of the results. Across the 8 test slides, HistoMetriX processed 103 mm² in 326 seconds, corresponding to 5.3 minutes per cm² overall. Each slide adds a fixed processing time of approximately 20 to 30 seconds, so larger sections are processed more efficiently: 2.9 minutes per cm² for the three sections larger than 15 mm². The timed steps included compartment segmentation and area measurements, without cell detection. Tests were performed on an AMD Ryzen 9 7900 with 64 GB RAM and an NVIDIA GeForce RTX 5060 Ti with 16 GB memory.
The evaluation included 8 test slides from a single dataset and a single stain (PAS). These results therefore describe this dataset and should not be generalized to every staining protocol, species or sample type. The model was trained on 24 slides from the same dataset, and three test slides were evaluated within predefined regions of interest. The stratum corneum may be under-segmented when it is thin or detached, while some skin appendages can occasionally be classified as epidermis.
Salam, A.A., Akram, U., Asaf, Z., Rao, B. and Khan, S. DERMA-PASeg. Mendeley Data, Version 1 (2024). https://doi.org/10.17632/w8vxx8yz55.1
Oskal, K.R.J., Risdal, M., Janssen, E.A.M., Undersrud, E.S. and Gulsrud, T.O. A U-net based approach to epidermal tissue segmentation in whole slide histopathological images. SN Applied Sciences, 1, 672 (2019). https://doi.org/10.1007/s42452-019-0694-y
Compatible skin samples and stains
HistoMetriX analyzes human skin biopsies and animal skin samples from pig, rabbit, rat and mouse, including mouse ear and back skin, which are commonly used in inflammation and psoriasis-like models.
For species, sample types or stains that differ substantially from the data used to train the models, the segmentation can be retrained from a limited number of annotated slides using Train AI.
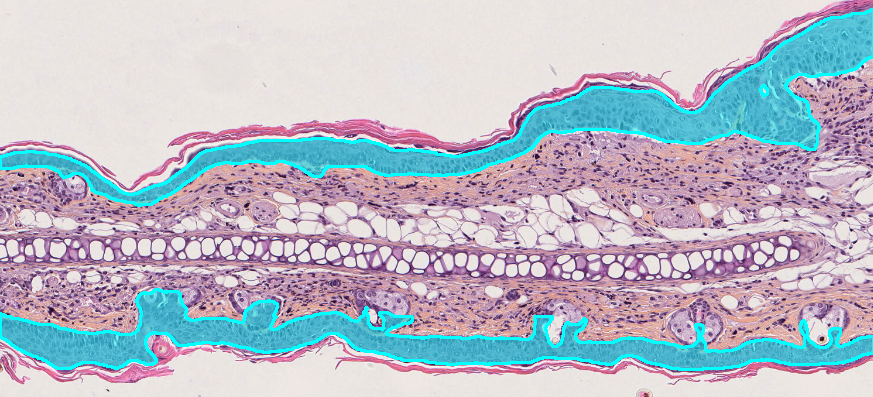
Cross-section of mouse ear skin with the epidermis on both tissue surfaces automatically segmented and highlighted in cyan by HistoMetriX.
© QuantaCell
The skin analysis pipeline supports brightfield and fluorescence images with the following staining methods:
Brightfield. H&E, HES (hematoxylin-eosin-saffron), Masson’s trichrome, Fontana-Masson, PAS and IHC with a DAB marker and hematoxylin counterstain.
Fluorescence. A nuclear channel alone or combined with dedicated markers for the epidermis, dermis or other structures of interest.
Public dataset validation. Segmentation of the stratum corneum, epidermis and dermis was evaluated on PAS-stained human skin sections from the DERMA-PASeg dataset.
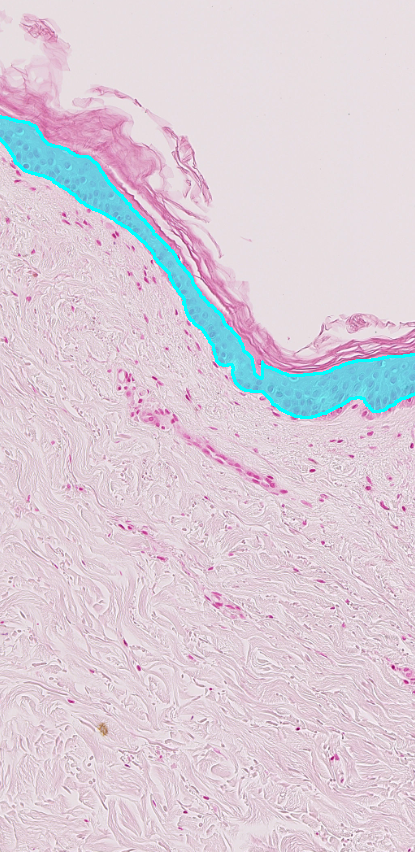
Automatic epidermis segmentation on an eosin-stained skin section
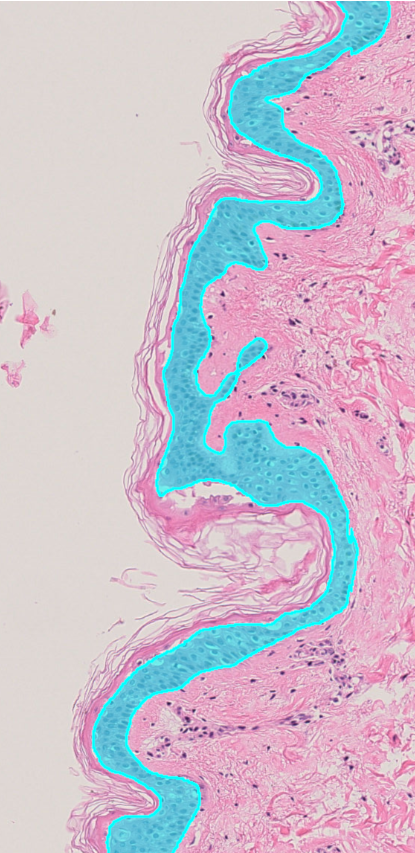
Automatic epidermis segmentation on an H&E-stained skin section.
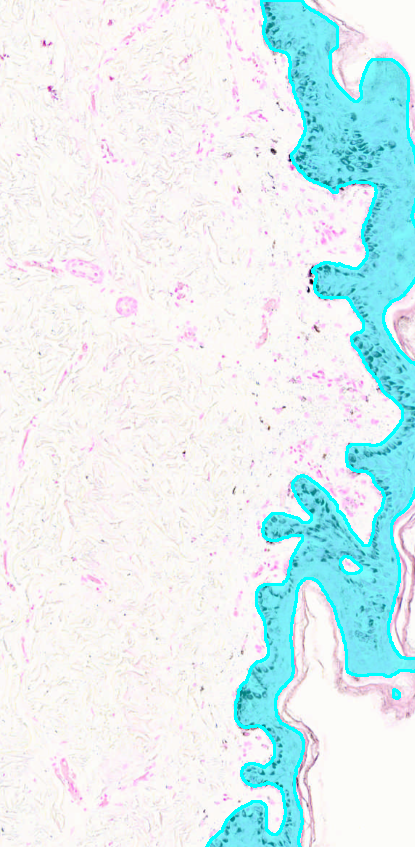
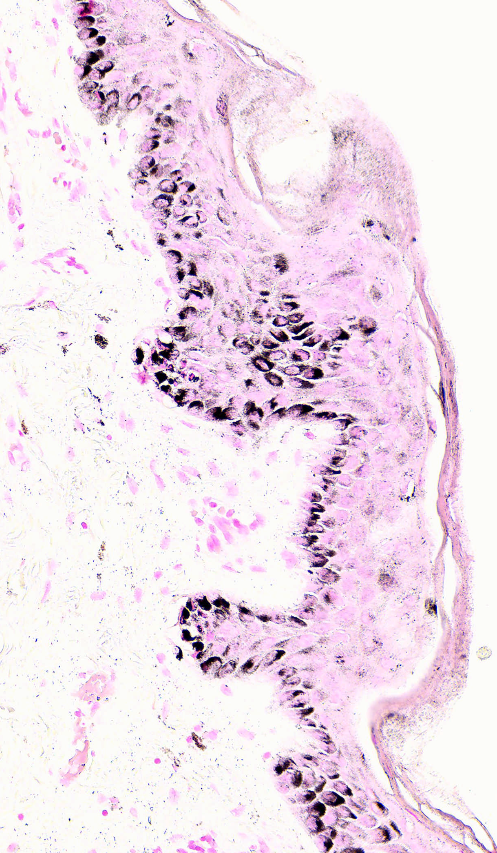
Automatic epidermis segmentation on a Fontana-Masson-stained skin section, with melanin deposits shown in black.
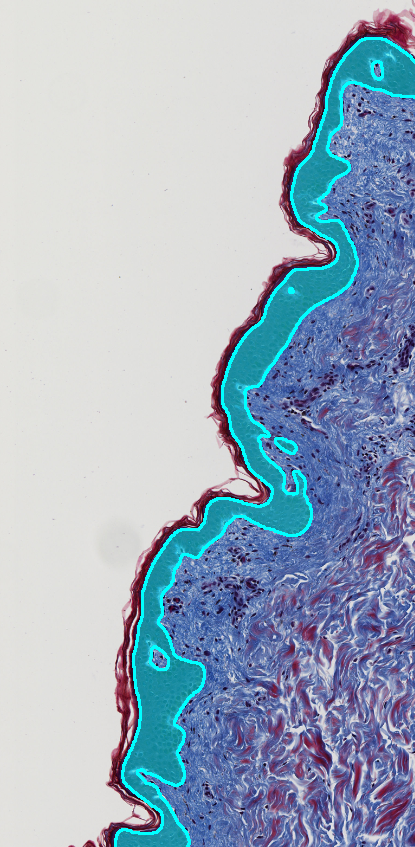
Automatic epidermis segmentation on a Masson’s trichrome-stained skin section.
Beyond morphometry: advanced skin analysis
Beyond the standard compartment segmentation, HistoMetriX can generate depth-based subregions or use custom models trained on annotated images to identify specific skin structures. Measurements can then be reported separately for each sub-compartment.
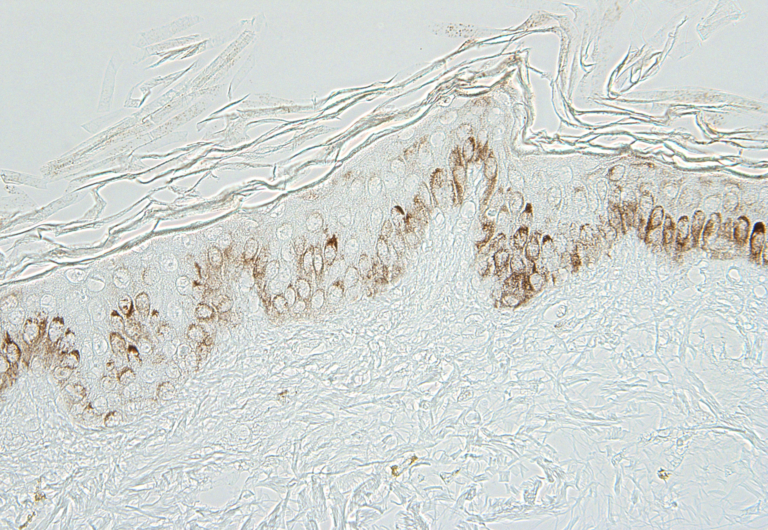
Original IHC-stained skin section before spatial subdivision.
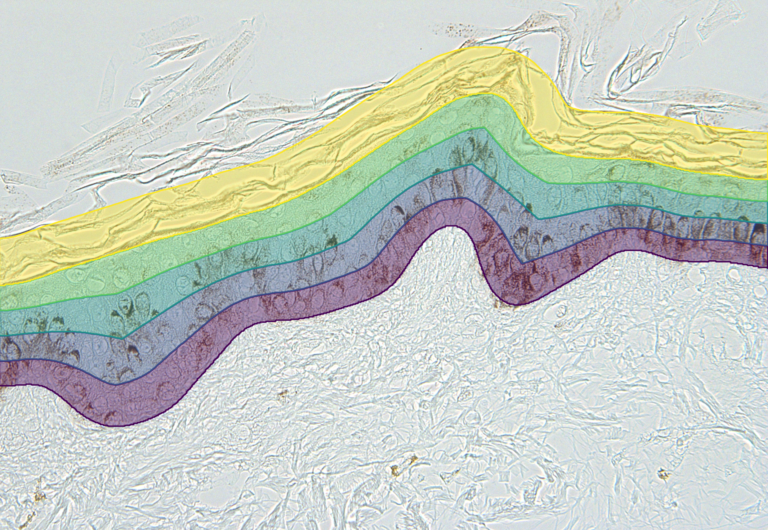
HistoMetriX divides the epidermis into four color-coded subregions based on relative depth, from the basal boundary to the surface. A fixed-width superficial band is generated above the epidermis to analyze the stratum corneum separately.
HistoMetriX detects nuclei within the dermis and measures their distance to the epidermis. Nuclei can then be grouped into distance bands or analyzed along a continuous gradient to compare superficial and deeper dermal populations, quantify marker positivity or assess inflammatory cell infiltration.
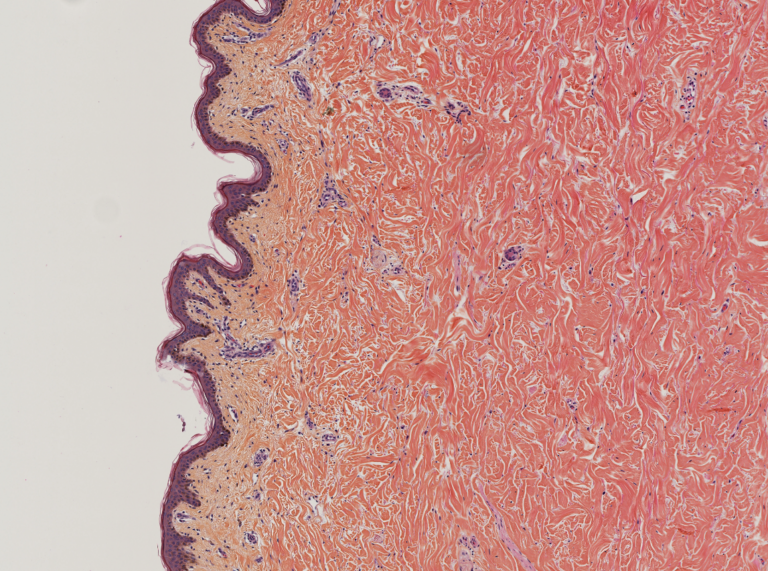
Original skin section before spatial analysis.
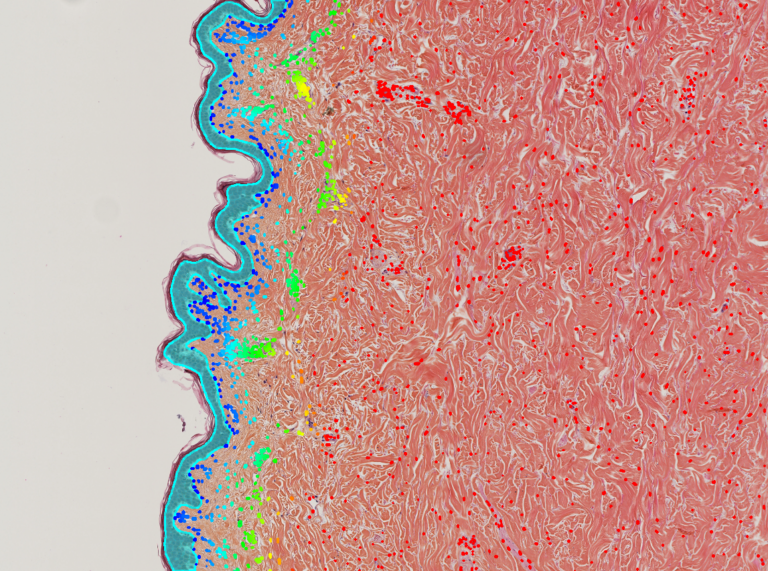
The epidermis is segmented in cyan. Detected dermal nuclei are color-coded according to their distance from the epidermis, from red for the nearest nuclei to yellow for the most distant.
The same compartment-based workflow can be applied to fluorescence and in situ hybridization images. The epidermis and dermis can be identified using dedicated markers or, when tissue morphology allows it, directly from the nuclear channel. Signals from ISH, FISH or DISH can then be quantified separately within each compartment.
Automated segmentation of skin compartments and quantitative epidermal morphometry are established fields of computational pathology. The scientific context of the HistoMetriX skin pipeline includes:
- Automated identification of skin layers in histology images: Brindise et al., Annals of Biomedical Engineering, 2023. DOI: 10.1007/s10439-022-03106-9. pubmed.ncbi.nlm.nih.gov
- Deep-learning segmentation of the epidermis in whole-slide images: Oskal et al., SN Applied Sciences, 2019. DOI: 10.1007/s42452-019-0694-y. link.springer.com
- Validation of epidermal segmentation and morphometric measurements using the public DERMA-PASeg dataset. DOI: 10.17632/w8vxx8yz55.1. data.mendeley.com
- Color deconvolution based on established brightfield histology quantification methods: Ruifrok and Johnston, 2001. PMID: 11531144.
Do I need to train a model or annotate images?
No. The Skin Morphology pipeline is ready to use. Load your slides, select a region mode and run the analysis. No parameter adjustment or model training is required for most studies. For specific stains, pathologies or species, or to identify finer sub-compartments, the models can be fine-tuned using your own annotated images with Train AI.
How is epidermal thickness calculated?
HistoMetriX measures the epidermal area, the length of the epidermis along its midline and the length of the dermal-epidermal junction. Mean epidermal thickness is calculated by dividing the epidermal area by either length. Both values are available for each sample, field and batch.
Can I reproduce the standard 10-field protocol?
Yes. In Mode 3, draw one region of interest, duplicate it and place the copies along the epidermis. Results are reported for each field and can then be averaged for each slide.
What if a slide contains several samples?
Mode 2 automatically detects and labels each sample. Before running the analysis, you can remove a region, reshape an outline or rename a sample.
Can I analyze cells according to their distance from the epidermis?
Yes. Each detected cell can be classified according to its distance from the epidermis. For example, dermal cells located within 100 µm of the epidermis can be analyzed separately from cells located deeper in the dermis.
Which samples and stains are supported?
HistoMetriX can analyze human skin biopsies and animal skin, including pig, rabbit, rat and mouse samples. Supported stains include H&E, HES, Masson’s trichrome, PAS, IHC with DAB, fluorescence, ISH, FISH and DISH. Contact us to confirm compatibility with a specific sample type or staining protocol.
Which file formats can I open?
HistoMetriX supports SVS, NDPI, TIFF and MRXS whole-slide images.
Where does the analysis run?
HistoMetriX is a Windows desktop application. Analyses run locally on the user’s computer and do not require image data to be uploaded to the cloud.
Can HistoMetriX be used for diagnosis?
No. HistoMetriX is a research-use-only (RUO) tool. It is not intended for clinical diagnosis or patient management decisions.
How can I try it?
Request a trial licence and run the pipeline on your own skin slides.
Try HistoMetriX for free with your own data!
Request a demoDiscover our quantitative histological image analysis service
Discover the service