
Simplify histology image analysis with HistoMetriX

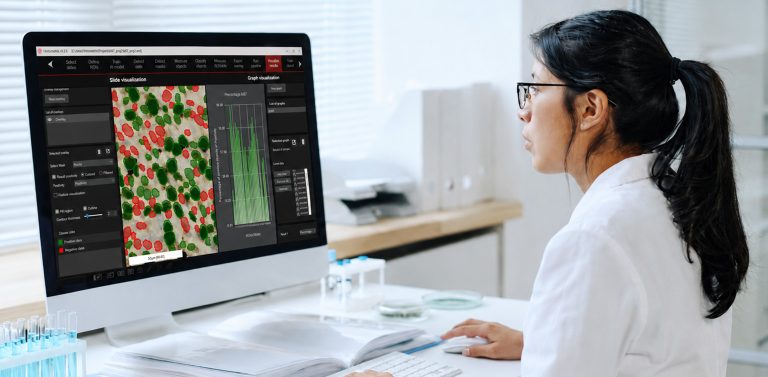



Why choose
HistoMetriX?
HistoMetriX transforms your histology images into reliable, actionable quantitative data.
Powered by Deep Learning and an intuitive interface designed for biologists and pathologists, HistoMetriX helps you automate your analyses, explore tissue structures, and quantify cells and biomarkers—without requiring advanced image analysis expertise.
Let’s dive into quantitative histology together!

-
Performance
Analyze more images, faster.
Process multiple slides, automate your quantifications, and instantly visualize your results to accelerate your studies. -
Easy to use
From images to results in just a few clicks.
An intuitive, workflow-based interface guides you through every step of the analysis—no programming or advanced technical skills required. HistoMetriX is compatible with major image formats and slide scanners. -
Versatility
One software, multiple applications.
Cell detection, tissue segmentation, biomarker quantification, morphometric measurements, or spatial analysis: adapt your workflows to your projects in research, pharma, biotech, CRO, or dermo-cosmetics. -
Security
Your images stay with you.
HistoMetriX runs directly on your computer, with no data transferred to the cloud. Your images and data remain within your laboratory and under your control. -
Our customer support
Image analysis experts by your side.
At QuantaCell, we provide more than just software. Our team supports you in getting started with HistoMetriX, building your analyses, and adapting workflows to your scientific needs.
From Histology Images to Quantitative Insights
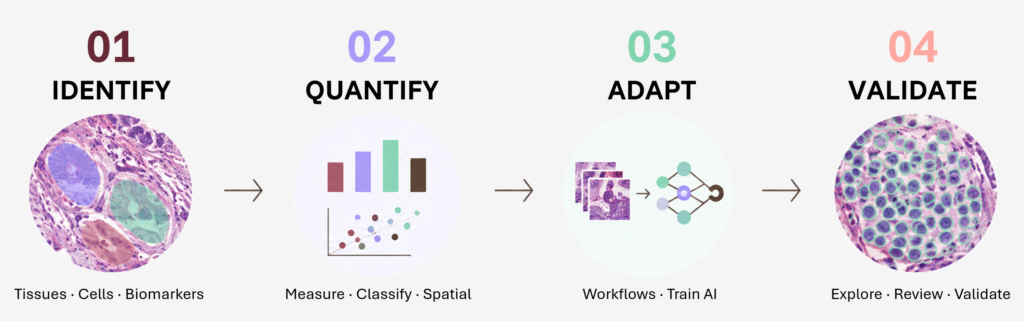
Turn your digitized histology slides into meaningful, quantitative insights with HistoMetriX. From tissue and cell detection to biomarker quantification and spatial analysis, HistoMetriX brings the entire image analysis workflow into one intuitive environment.
-
Detection of nuclei
HistoMetriX automatically detects nuclei in histology and fluorescence images, enabling reliable and reproducible cell counting.
Features:
- Automatic nucleus detection across whole slides or within regions of interest (ROIs).
- Pre-trained Deep Learning models for robust cell detection, regardless of the staining method.
- Measurement of morphological and intensity features for each detected nucleus.
- Direct visualization and validation of detections on the image.
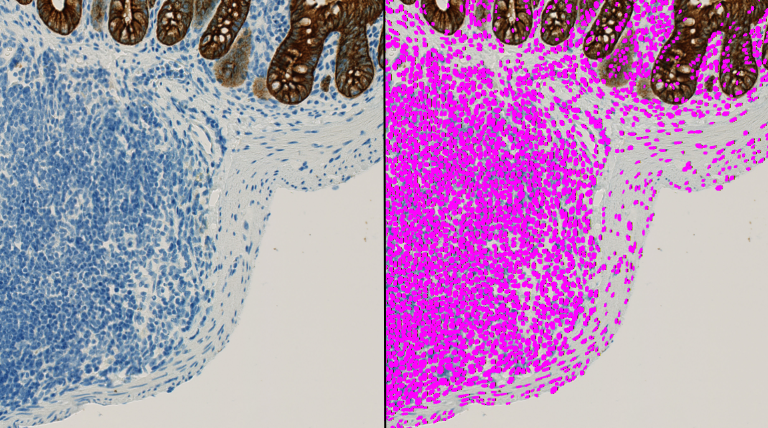
Nucleus detection across different cell densities and staining conditions.
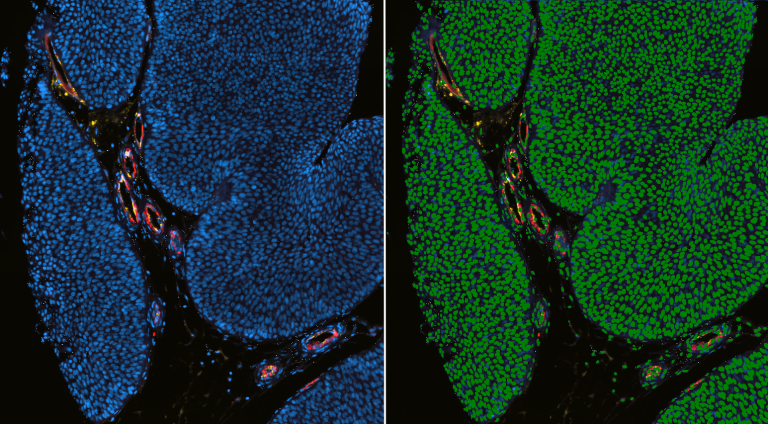
Nuclei detection with fluorescence staining (DAPI)
-
Membrane Detection
HistoMetriX detects cell boundaries from membrane staining to segment individual cells and accurately quantify their signals.
Features:
- Automatic membrane detection and cell segmentation.
- Pre-trained Deep Learning models for robust cell segmentation across different staining conditions.
- Measurement of biomarker intensity at the single-cell level.
- Integration of nuclear and membrane information for comprehensive single-cell analysis.
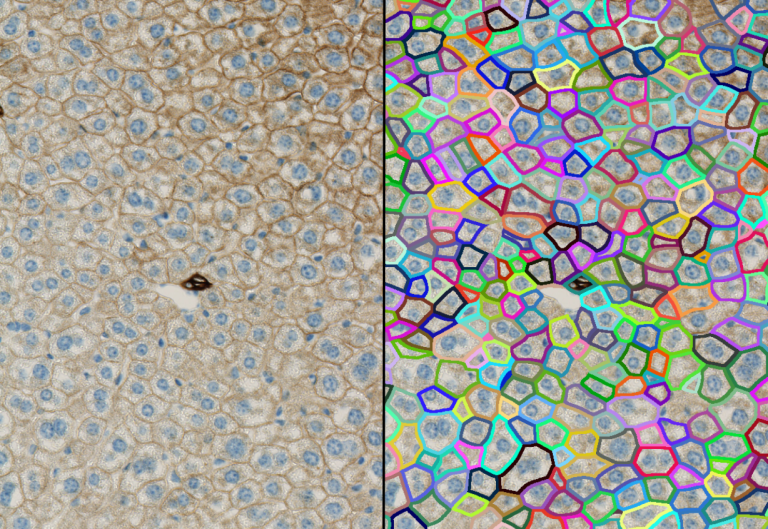
Membrane detection in brightfield condition
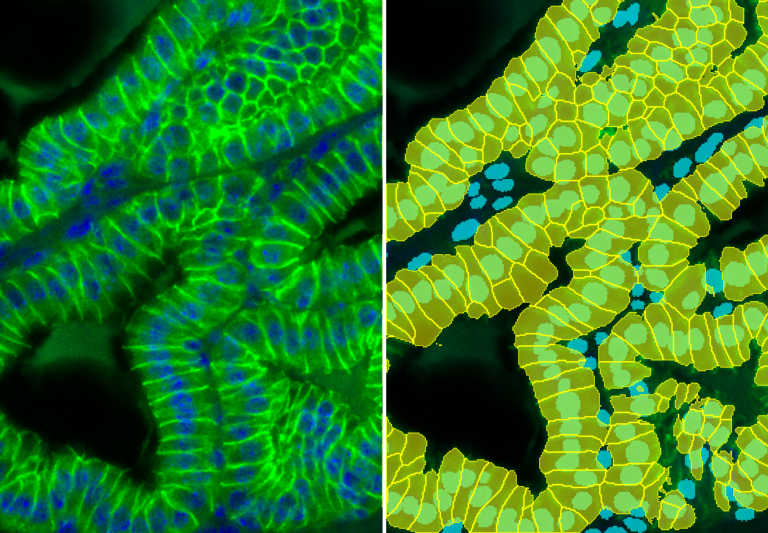
Membrane detection in fluorescence condition
-
Detection of tissue
HistoMetriX automatically segments different structures in your histology slides, enabling you to quantify cells and biomarkers within their tissue context.
Features:
- Automatic segmentation of multiple tissue structures and compartments.
- State-of-the-art Deep Learning models, including Vision Transformers, combining speed, accuracy, and adaptability.
- Quantification of cells, biomarkers, and morphological features within each region.
- Direct visualization of tissue segmentation on the slide for easy review and validation.
Detection of epidermis under various brightfield stainings with one deep learning model
Detection of tumor areas
-
AI training and pre-trained models
Harness the power of state-of-the-art Deep Learning directly within HistoMetriX. Use pre-trained models or create your own from your annotations to tailor image analysis to your tissues, staining protocols, and biological questions.
AI in HistoMetriX:
- Ready-to-use pre-trained models for detecting nuclei, cells, membranes, and tissue structures.
- Train your own custom models directly from your images and annotations, with no coding required.
- State-of-the-art Deep Learning architectures, including fast, high-performance models and Vision Transformers.
- Adapt models to your own tissues and applications, whatever biological structures you are studying.
- Reuse and share validated models to accelerate new studies and standardize analyses across projects.
From your annotations to your own AI model, directly within HistoMetriX.
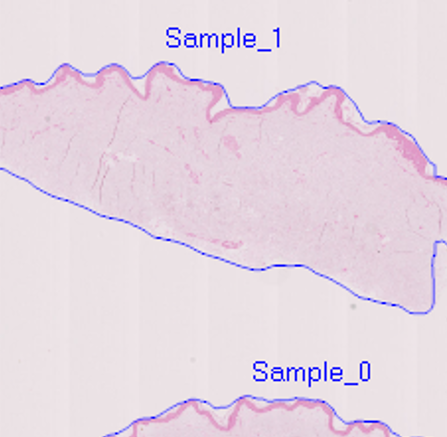
Automatic detection of the tissue sample, its boundaries, and tissue region on digitized histology slides (Whole Slide Images).
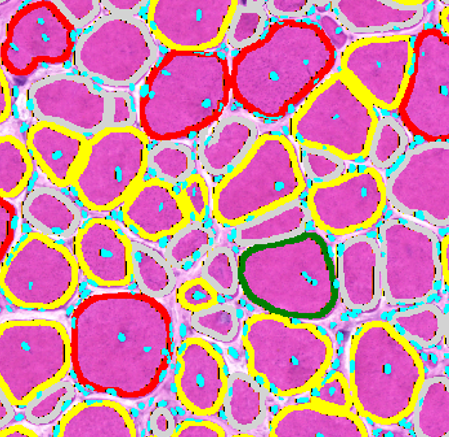
Automatic detection and segmentation of muscle fibers for quantitative analysis of their morphology, size, area, and organization within the tissue.
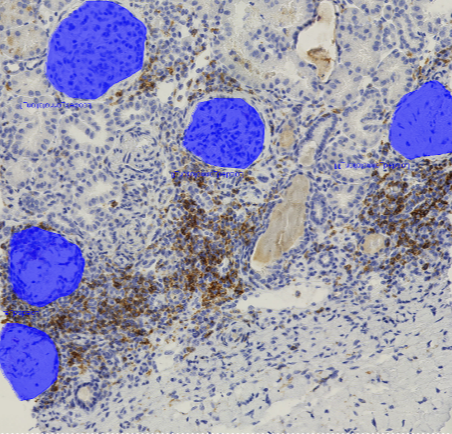
Automatic detection and segmentation of glomeruli for quantitative analysis of kidney structures, including their morphology, size, area, and distribution within the tissue.
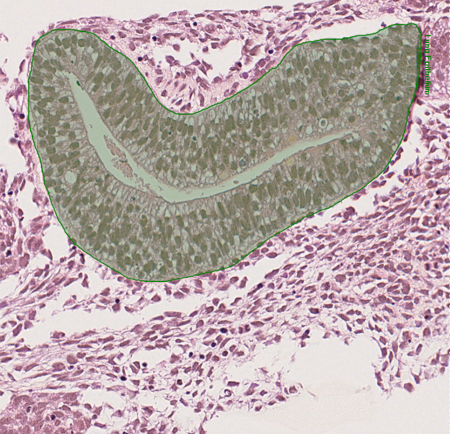
Automatic detection and segmentation of lung epithelium for quantitative analysis of airways, tissue morphology, and structural organization.
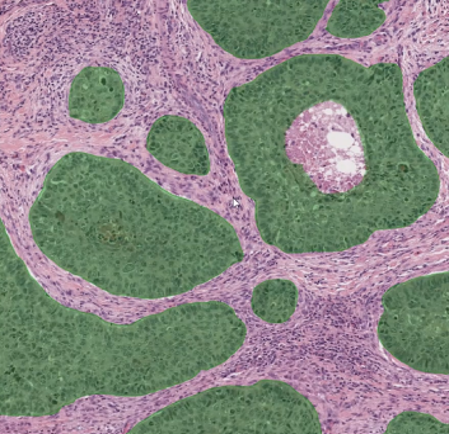
Automatic detection and segmentation of tumor regions for quantitative analysis of tumor morphology and the surrounding tumor microenvironment.
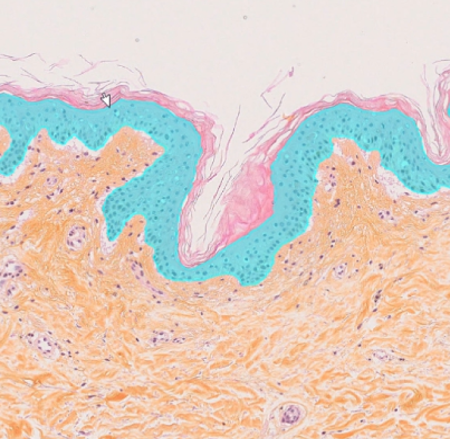
Automatic detection and segmentation of the epidermis for quantitative analysis of its thickness and morphology. The approach can be adapted to other layered structures, such as the dermis, cornea, and other tissue compartments.
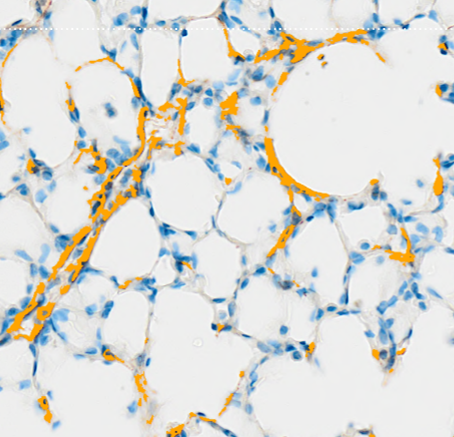
Automatic detection and quantification of fibrosis and associated structures to characterize tissue remodeling, including fibrotic areas, collagen, and their organization within the tissue.
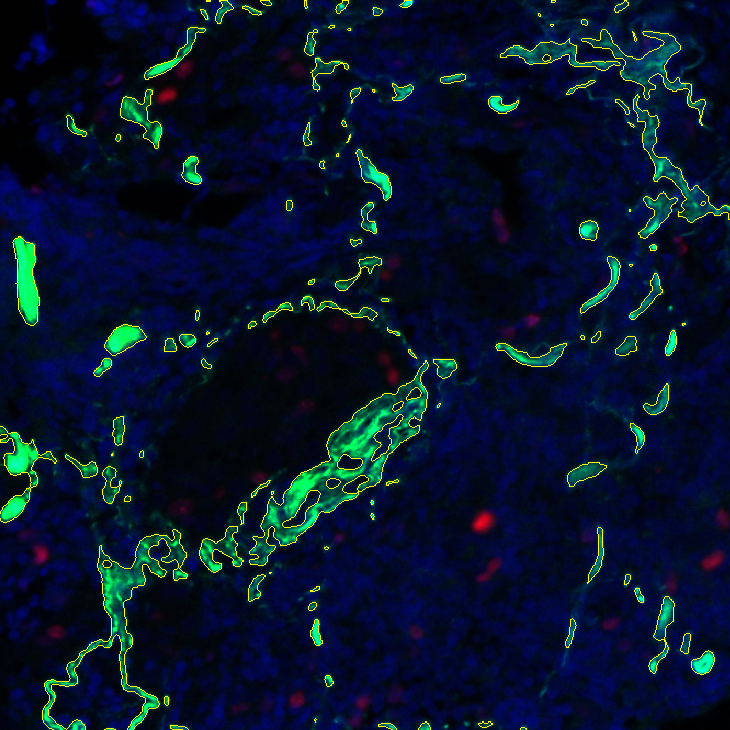
Automatic detection and quantification of fibrosis in fluorescence images of lung tissue.
-
Cell classification
HistoMetriX enables you to identify and quantify different cell populations based on their intensity, morphology, or location within the tissue.
With HistoMetriX, you can:
- Define cell populations by combining as many thresholds as needed across intensity, morphological, or spatial features.
- Train Machine Learning models from your own annotations to automatically classify cells.
- Automatically explore populations within your data using unsupervised clustering and automatic thresholding methods.
- Visualize different populations directly on the image and quantify their abundance and distribution.
Threshold-based Classification
Simply define your cell populations by combining as many thresholds as needed across intensity, morphological, or spatial features.
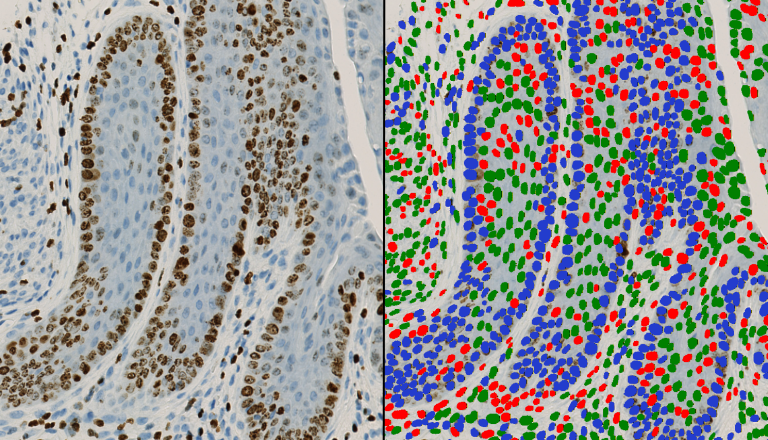
Nuclei detection and classification (red and green), DAB segmentation (blue)
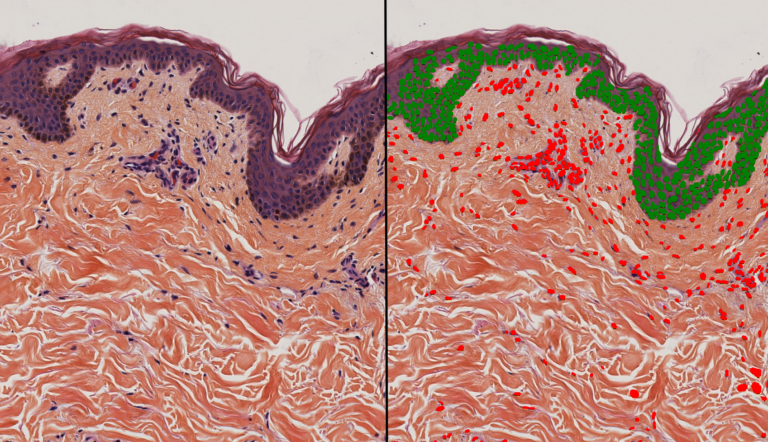
Classification of nuclei in epidermis (green) and dermis (red)
Supervised Machine Learning Classification
Annotate examples of the populations you want to identify and train HistoMetriX to automatically classify cells based on their features.
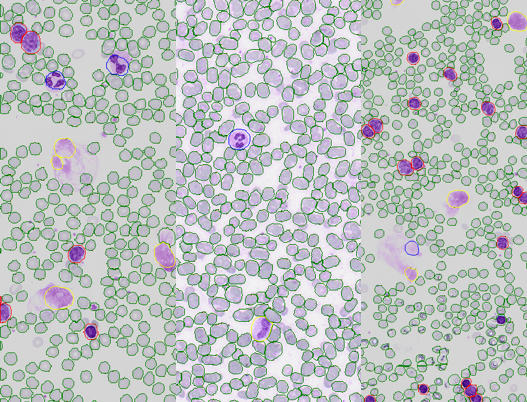
Automatic classification of different blood cell populations from user-annotated examples.
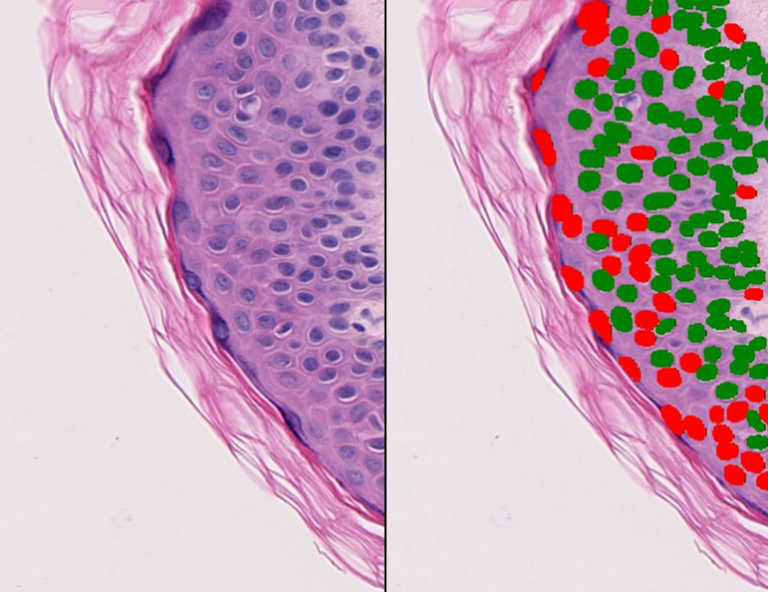
Classification of vacuolated and non-vacuolated cells for quantitative assessment of skin vacuolization.
Unsupervised Classification
Automatically explore populations within your data using unsupervised methods such as clustering and automatic thresholding.
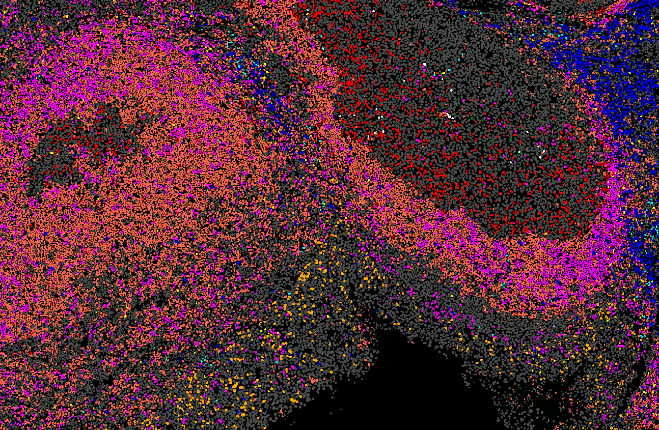
Example of unsupervised cell clustering and classification into 10 cell populations (B cells, T helper cells, etc.).
-
Quantification & Spatial Analysis
HistoMetriX transforms detected cells and tissue structures into quantitative and spatial data, enabling you to characterize tissues, cell populations, biomarker expression, and their spatial relationships.
With HistoMetriX, you can:
- Quantify cell populations: measure cell counts, densities, and proportions of different cell populations.
- Measure spatial relationships: analyze distances and proximity between cells, cell populations, and tissue structures.
- Characterize cell distribution within tissues: assess local density, infiltration, and accumulation within specific tissue regions.
- Quantify tissue structures and compartments: measure area, thickness, length, and morphological features.
- Measure biomarker expression: quantify marker intensity at the single-cell level or within regions of interest.
- Analyze marker colocalization: quantify the co-expression and spatial association of multiple biomarkers.
- Detect and quantify spots: analyze spots and other subcellular signals within cells and tissues.
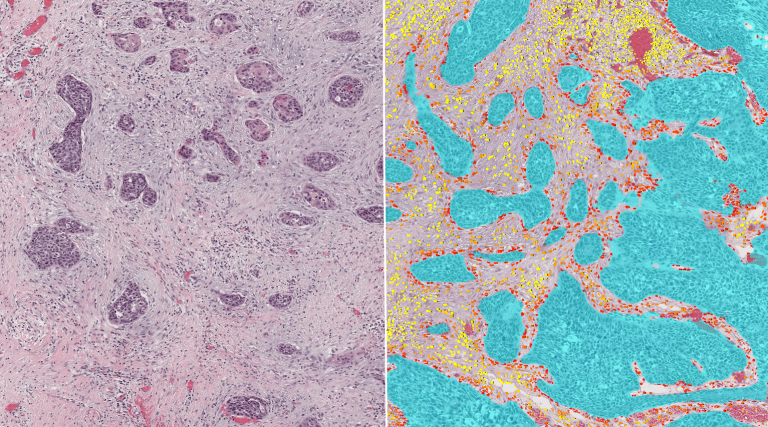
Spatial analysis of distances between cells within the tumor microenvironment, from nearest to farthest.
-
Results Visualization and Exploration
HistoMetriX allows you to explore your results directly within their biological context, linking quantitative data to the corresponding cells, structures, and regions in your images.
With HistoMetriX, you can:
- Visualize your quantitative results using graphs and distributions.
- Explore results within a region of interest (ROI) and compare different areas of your tissues.
- Select an object or population in your data and locate the corresponding elements directly in the image.
- Visually review your results to validate segmentations, classifications, and quantifications.
- Interactively explore your data to easily identify trends, populations, and values of interest.
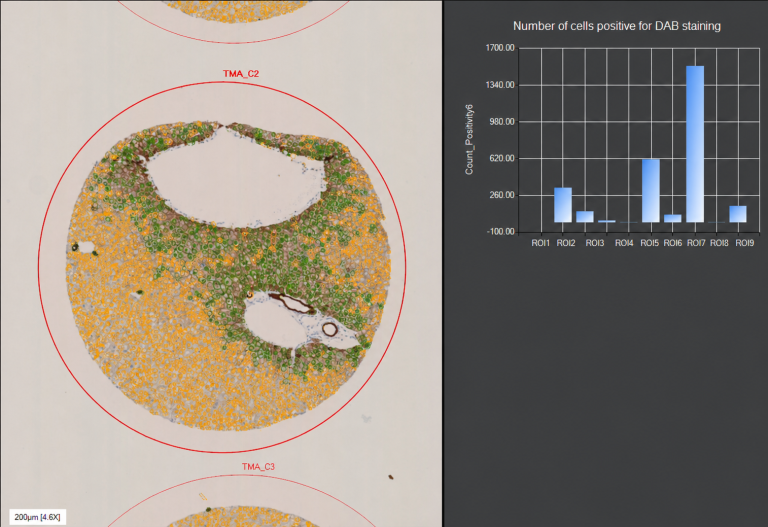
Visualization of the results on a ROI
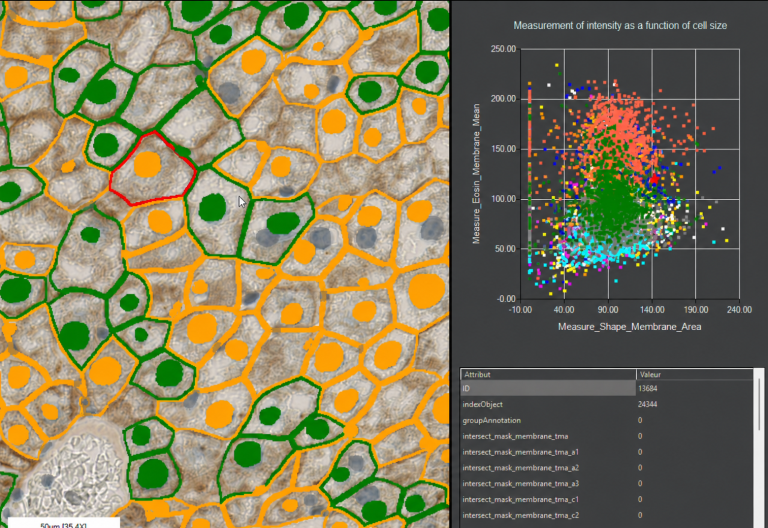
Visualization of the results on a detected object
-
Working with 3D tissues or biological models?
Discover AssayScope, our 3D image analysis solution for tissues, organoids and spheroids.
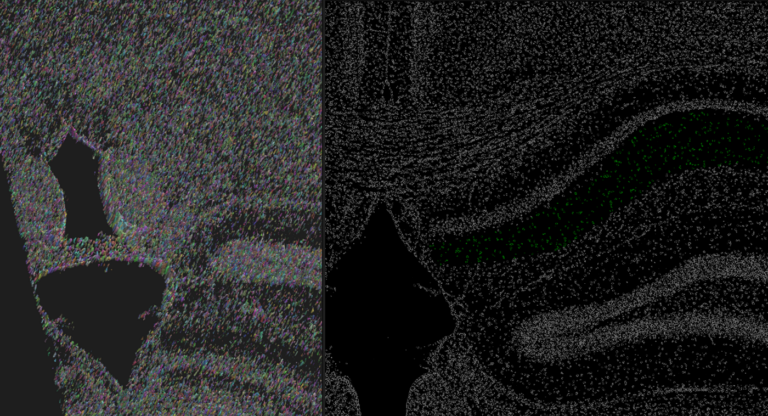
3D analysis of rat brain tissue with cell segmentation and gating of a specific cell population.
Discover HistoMetriX for free with your own images!
Request a demoDiscover our quantitative histological image analysis service
Discover the service