
APPLICATIONS · ONCOLOGY
Cancer image analysis for oncology research
Any cancer, any cell type, any biomarker
Every tumor tells its story in images: how cancer cells are organized, which immune cells reach them, which biomarkers they express, and how they respond to treatment. QuantaCell turns histology, digital pathology, multiplex and 3D microscopy images into objective, reproducible quantitative data, for any cancer type, any cell population and any number of biomarkers.
Run the analysis yourself with our software, or entrust it to our image analysis experts: we support oncology projects from basic cancer biology and preclinical models to translational and clinical research.
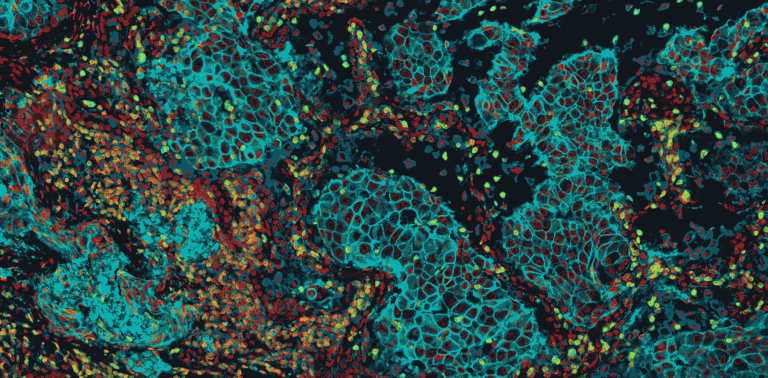

Any cancer, any cell type, any biomarker
All tumor types and tissues. We have analyzed breast, lung, colorectal, prostate, ovarian, pancreatic, liver and brain tumors, melanoma, sarcomas, lymphomas and many more. Some indications come with ready-to-use models; for the others, we adapt our methods or train dedicated deep learning models on your own annotations, whatever your tissue or staining.
All cell populations. Tumor cells, T and B lymphocytes, macrophages and other immune cells, fibroblasts, endothelial cells: any population that can be defined by markers, morphology or location can be detected, classified and counted.
No limit on the number of biomarkers. From single-marker brightfield IHC to multiplex immunofluorescence, combine as many markers as your panel contains to define cell phenotypes, measure co-expression and explore populations with supervised or unsupervised methods.
Brightfield and fluorescence. H&E and IHC in brightfield, immunofluorescence and multiplex fluorescence on tissue sections, whole-slide images from the main scanners, and 2D, 3D and time-lapse fluorescence microscopy of cells, spheroids and organoids.
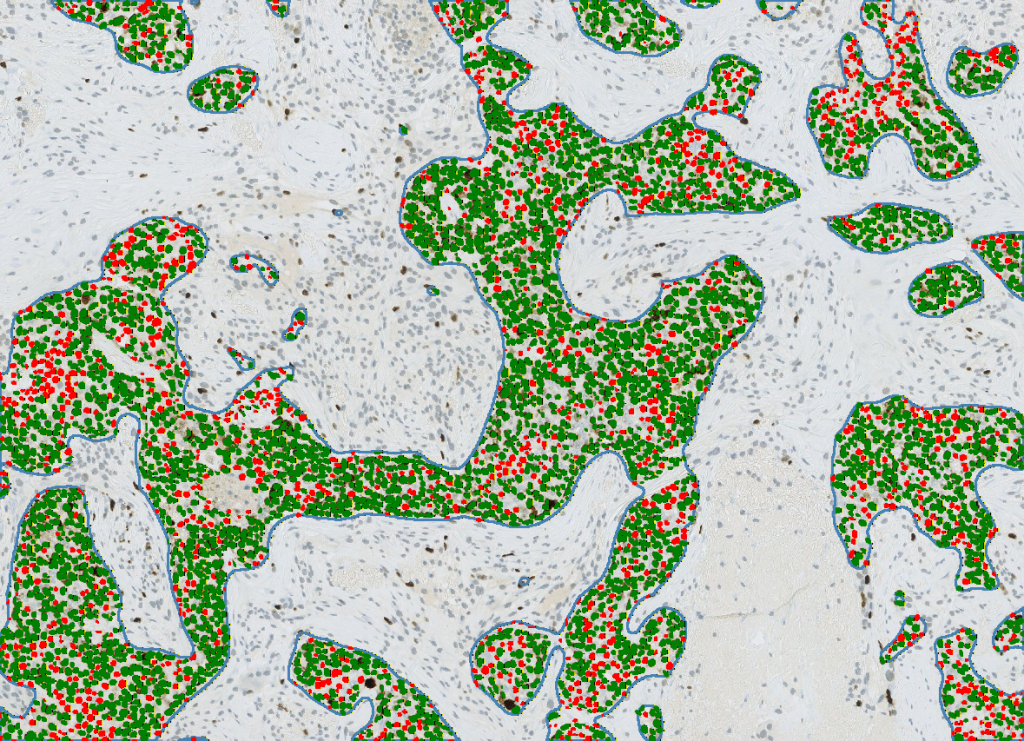
AI-powered detection and classification of tumor cells (Ki67-positive and negative nuclei)
What we measure in tumors
Tissue architecture. Segmentation of tumor, stroma, necrosis, invasive margin and other compartments, with area, shape and morphological measurements, so that every result is reported in its biological context.
Cell detection and phenotyping. Nuclei and membrane segmentation at the single-cell level, then classification of cell populations by thresholds, machine learning trained on your annotations, or unsupervised clustering.
Biomarker quantification. Marker intensity per cell or per region, positive cell percentages, H-scores, co-expression and colocalization across any number of markers. Proliferation indices such as Ki67 are one example among many.
Tumor microenvironment and spatial biology. Immune infiltration, cell densities by compartment, distances between populations, proximity to the tumor border, neighborhoods and cell-to-cell interactions.
Nuclear and cellular morphometry. Size, shape and texture features of nuclei and cells, to characterize tumor phenotypes and their changes under treatment.
Custom AI models. When an endpoint is new, we train dedicated deep learning models for your structures, from rare cell types to specific histological patterns.
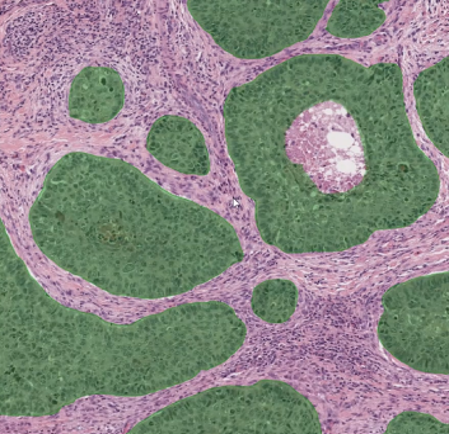
Deep learning segmentation of tumor regions

Automatic tumor detection restricting the analysis to tumor areas
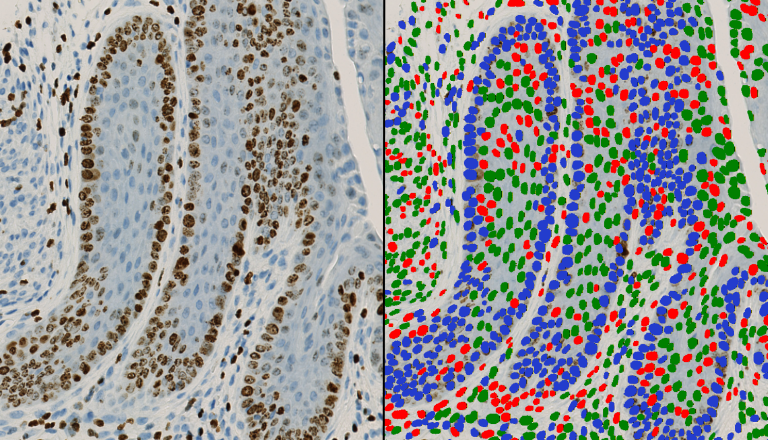
Cell classification by biomarker intensity on a tissue microarray (TMA)
Oncology readouts we deliver
Biomarker scores and indices. H-score, percentage of positive cells, 0/1+/2+/3+ intensity classes, Allred score, HER2-type membrane scoring, PD-L1 TPS and CPS, Ki67 and other proliferation markers (PCNA, phospho-histone H3, EdU/BrdU), apoptosis (cleaved caspase-3, TUNEL), DNA damage foci (γH2AX), FISH and RNA in situ hybridization spot counting.
Tumor architecture and morphology. Tumor, stroma and necrosis segmentation, tumor-stroma ratio, necrosis percentage, invasive margin and distance bands, tumor budding, mitotic count, nuclear morphometry and pleomorphism, fibrosis and collagen (Sirius red, Masson’s trichrome), microvessel density (CD31, CD34), and custom models for specific glands, structures and histological patterns.
Tumor microenvironment and immunity. Tumor-infiltrating lymphocytes on H&E, CD3 and CD8 densities in the tumor core and invasive margin, macrophages and their polarization (CD68, CD163), B cells, NK cells, dendritic cells and neutrophils, tertiary lymphoid structures, cancer-associated fibroblasts (α-SMA, FAP), and inflamed, excluded or desert immune phenotypes.
Multiplex and cell phenotyping. Multiplex immunofluorescence with no limit on the number of markers, brightfield double and triple IHC with color deconvolution, phenotyping by combined thresholds, supervised machine learning or unsupervised clustering, co-expression and colocalization (Pearson, Manders), and registration of serial sections.
Spatial analysis. Nearest-neighbor distances between populations, densities by compartment and distance band, cellular neighborhoods and cell-cell interactions, spatial statistics (Ripley’s functions, spatial clustering), density maps and hotspots.
Cellular and 3D models. Patient-derived organoids and tumoroids, spheroids, tumor-immune co-cultures including T-cell killing assays, cancer cell lines exposed to patient sera, size, volume and growth over time, live/dead viability, dose-response curves and IC50, invasion and migration, necrotic cores and lumens, Cell Painting-type morphological profiling, mitochondrial morphology, and plate-based high-content screening.
Studies and cohorts. Biopsies and tissue microarrays (TMA), preclinical models (xenografts, PDX, syngeneic models), patient cohorts linked to clinical data, multicenter studies with standardization across batches and scanners, integration with omics data, and optional methodological reports and quality traceability.
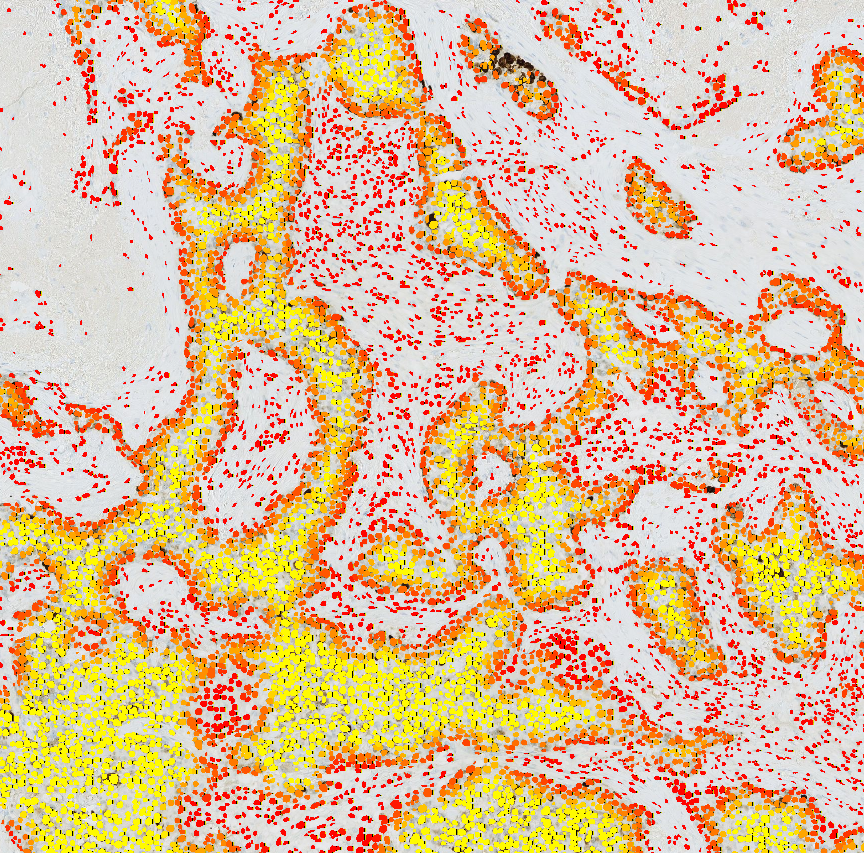
Spatial distance map of detected cells
Patient-derived and 3D cancer models
Cellular models bring the patient into the lab, but they generate large, complex fluorescence datasets. We analyze:
- Patient-derived organoids and tumoroids, to quantify patient-specific phenotypes and treatment responses.
- Spheroids and 3D co-cultures, including tumor and immune cells.
- Cancer cell lines exposed to patient sera, to compare responses between patients or conditions.
We segment and reconstruct organoids, cells and nuclei in 2D and 3D, then quantify volume, shape, fluorescence marker intensity, cell phenotypes and spatial organization. Time-lapse tracking follows growth and morphological changes, and plate-based analysis compares wells, compounds, doses, sera and time points in high-content screening experiments. Typical applications: treatment response, drug screening and patient stratification studies.
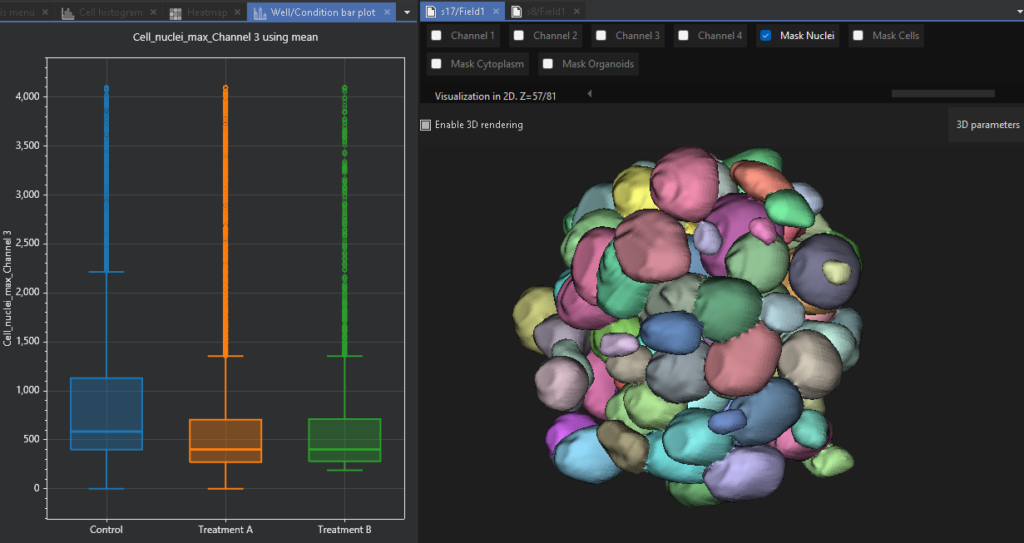
3D organoid rendering and quantification in AssayScope
3D tumor model analysis
Two ways to work with QuantaCell
Analyze your images yourself
- HistoMetriX for histology, digital pathology and multiplex imaging: tissue segmentation, cell detection, classification and spatial analysis, with pre-trained models or your own AI models trained without coding. HistoMetriX runs on your computer: your images never leave your laboratory.
- AssayScope for spheroids, tumoroids and 3D cultures: 2D/3D segmentation, multiparametric quantification, population gating and high-content screening.
Let our experts analyze them
- Histology & digital pathology image analysis services: tumor microenvironment, biomarker and multiplex studies, tissue architecture, preclinical and translational comparisons across cohorts.
- 3D organoid image analysis services: 2D/3D segmentation, time-lapse tracking, drug response and high-content screening.
Every service project starts with a free feasibility study on up to 5 representative samples. Standard analyses start from €1,500 and advanced projects with custom AI development from €3,000.
Examples of oncology questions we address
- Does a treatment change immune infiltration? Densities and proportions of immune populations in tumor and stroma, distances to tumor cells.
- Which phenotypes co-exist in a multiplex panel? Single-cell co-expression of all markers, phenotype clustering, spatial distribution.
- Is a biomarker associated with outcome in a cohort? Standardized marker readouts per patient, comparable across slides, batches and centers.
- How do patient-derived organoids respond to drugs? 3D size, shape, viability-related markers and growth over time, per well and per compound.
- How proliferative is the tumor? Ki67 or other proliferation indices, restricted to tumor areas if needed.
See an example: our automated Ki67 case study.
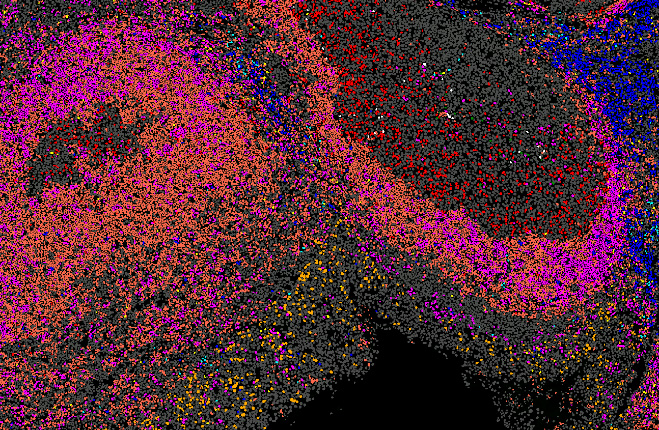
Clustering of cell populations on a histology section
Oncology research we contribute to
QuantaCell works with cancer research and clinical partners, including the Centre Léon Bérard in Lyon on quantitative cancer image analysis, the Department of Pathology of Montpellier University Hospital on AI-powered histology, cell classification and spatial analysis, and the IHU Immun4Cure on multimodal imaging and omics data. Our team has co-authored peer-reviewed work such as a study linking NLRC4 expression to cancer survival and immune infiltration (J Clin Invest, 2024), as well as deep learning methods for cancer imaging on CT scans.
FAQ
Which cancer types can you analyze?
Virtually all of them: our methods are not tied to one organ. Some tumor types come with ready-to-use models, and for the others we adapt the analysis to your request, your tissue and your staining.
How many biomarkers can you analyze together?
There is no fixed limit. We analyze single-marker IHC as well as multiplex panels, and phenotypes can combine as many markers as your panel contains.
Which image formats are supported?
Brightfield H&E and IHC, immunofluorescence and multiplex images, whole-slide images (for example SVS, NDPI, TIFF and MRXS), and 2D, 3D and time-lapse microscopy.
Do my images leave my laboratory?
Not with HistoMetriX, which runs locally with no transfer to the cloud. For service projects, you share your images through our dedicated Nextcloud server, or through the platform of your choice: OneDrive, Google Drive or your organization’s own file-sharing service.
Is this for diagnostic use?
No. Our software and services are intended for research use only.
Have an oncology imaging project?
Send us a few representative images: we will assess feasibility for free and recommend the best workflow, software or service.