
Analyze your 3D imaging experiments with AssayScope

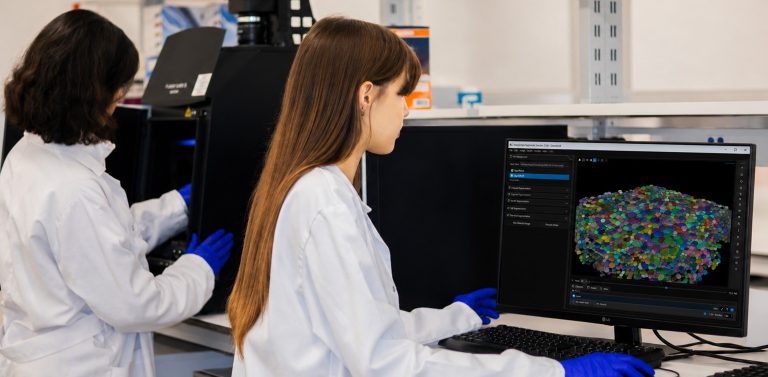



From 3D images to quantitative high-content analysis
AssayScope transforms complex 3D imaging experiments into quantitative, actionable data. Designed for organoids, spheroids, 3D cell cultures and tissues, it combines AI-powered segmentation, multiparametric quantification and high-content analysis in a single workflow.
Segment and quantify nuclei, membranes, organoids, labeled structures, spots and other objects of interest. Extract morphological, intensity and spatial features, explore populations through interactive gating, and compare results across fields, wells and experimental conditions. AssayScope supports plate-based imaging workflows, from image analysis to quantitative screening readouts.

-
Versatile 2D & 3D segmentation
Segment nuclei, membranes, organoids, labeled structures, spots and other objects of interest using AI-powered and advanced image analysis methods. -
Interactive 3D exploration
Visualize segmented objects and measurements directly within your 3D images and interactively explore your results. -
Multiparametric quantification
Automatically extract morphological, intensity and spatial features from every detected object. -
Population analysis & gating
Identify and explore subpopulations using morphological, intensity and spatial features, with interactive gating linked back to the images. -
Spatial analysis
Quantify distances, positions and spatial relationships between cells, organoids and other biological objects. -
High-content screening
Analyze plate-based experiments across fields, wells and conditions to generate quantitative screening readouts from large 3D imaging datasets.
AssayScope: powerful 3D image analysis designed for biologists
From advanced image analysis to biological insights
AssayScope brings advanced 3D image analysis and high-content screening into an intuitive environment designed for biological research. Analyze complex imaging experiments without building custom image analysis pipelines.
Built for biologists — Interactive tools make advanced 3D image analysis accessible without programming or image analysis expertise.
Stay connected to your images — Explore measurements, populations and gating results while keeping a direct link with the corresponding objects in your images.
From a single image to a complete experiment — Use the same workflow to analyze individual 3D images or large plate-based experiments across fields, wells and conditions.
-
Versatile 2D & 3D segmentation
AssayScope Segmenter detects and segments a wide range of biological objects in 2D and 3D images, including nuclei, membranes, organoids, labeled structures and spots. AI-powered and image-processing methods can be combined and adapted to different biological structures and imaging conditions.
3D nuclei segmentation in an organoid
3D segmentation of nuclei and cell membranes
Features — Combine AI-powered and image-processing methods in flexible 2D and 3D workflows adapted to different image resolutions, acquisition conditions and biological structures. Automatically extract morphological, intensity and spatial measurements from segmented objects..
User experience — Build and adjust segmentation workflows through an interactive interface, without programming. Inspect segmentation results directly on your images and in 3D, then export your results or continue the analysis in AssayScope Profiler.
Interactive assessment of 3D nuclei segmentation
3D cell segmentation for quantitative analysis
© Images of organoids courtesy from Furlan and Vincent, CANTHER lab and OrgaRes platform, Univ.Lille, CNRS, Inserm
-
Multiparametric quantification & spatial analysis
Once objects are segmented, AssayScope automatically extracts quantitative features describing their morphology, intensity and spatial organization. Measurements can be performed at different biological levels, from individual nuclei and cells to organoids and other structures of interest.
Features — Quantify morphological and intensity features for each segmented object. Measure positions, distances and spatial relationships between objects and structures. Analyze object localization within organoids or other regions of interest to characterize their spatial organization.
User experience — Measurements are automatically associated with each segmented object and remain linked to the original images. Explore quantitative results while keeping direct visual feedback on the corresponding biological structures.
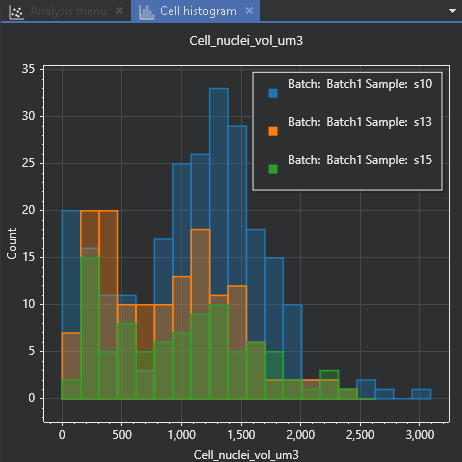
Distribution of nuclei volumes (µm³)
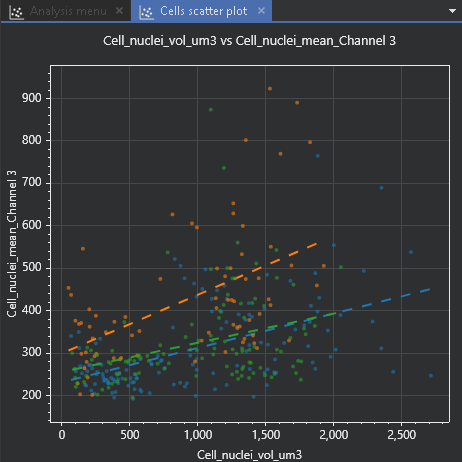
Nuclei volume versus average intensity in a Channel
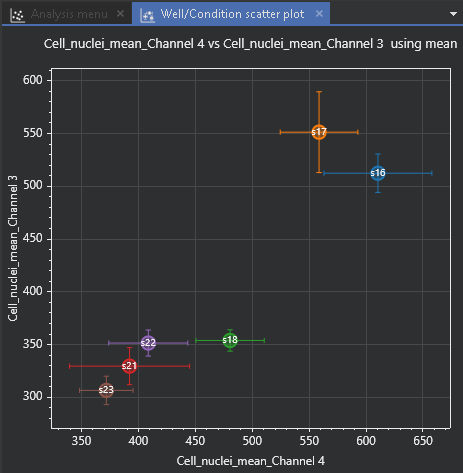
Well-to-well variability across experimental conditions
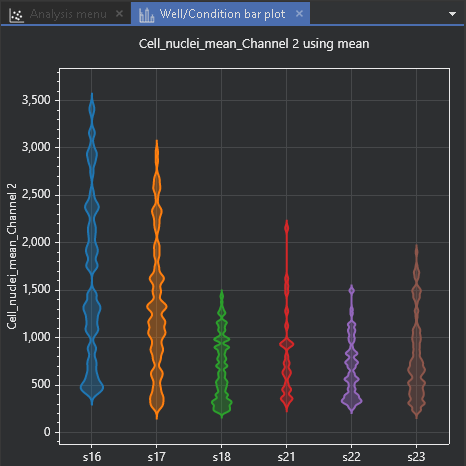
Comparison of a Channel average intensity across experimental conditions
-
Population analysis & interactive gating
AssayScope turns quantitative measurements into biologically meaningful populations. Explore and classify cells, organoids or other objects according to their morphological, intensity and spatial properties.
Features — Create populations using interactive gating based on any combination of quantitative features. Explore morphological, intensity and spatial parameters to identify phenotypes and subpopulations of interest.
User experience — Keep a direct connection between data and images: select a population or gated region and immediately visualize the corresponding objects in their original 2D or 3D context. Refine your gates interactively while exploring your biological data.
Interactive gating based on distance to the organoid border with real-time 2D and 3D image feedback
Gating with 3D image feedback
© Images of organoids courtesy from Furlan and Vincent, CANTHER lab and OrgaRes platform, Univ.Lille, CNRS, Inserm
-
High-content analysis & screening
AssayScope extends quantitative 3D image analysis to complete plate-based experiments. Organize and analyze large imaging datasets across plates, wells, fields and experimental conditions, from segmented objects to screening readouts.
Features — Automatically organize images and quantitative data according to plate, well, field and experimental condition. Compare measurements and populations across wells and conditions, and generate aggregated statistics for high-content experiments.
User experience — Navigate from plate-level results down to individual populations and objects while keeping a direct connection with the original images. Explore experimental effects interactively and identify the biological objects driving your quantitative readouts.
Explore HCS readouts from the plate heatmap down to the images of individual wells
Multiparametric comparison of quantitative readouts across experimental conditions
Try AssayScope for free with your own data!
Request a trial versionDiscover our quantitative histological image analysis service
Discover the service